9th Class

*         Terms Related to Probability   The following are the terms related to describe the concept of probability:     *           Event The outcomes of a random experiment is called its elementary event. When one coin is tossed, H and T is possible outcome. That is why Getting head is an elementary event. When two coins are tossed, the sample space of this experiment is {HH, HT, TH, TT} Events are HH, HT, TH and TT are the events of random experiment of tossing two coins.     *         Compound Events When two or more than two elementary events occur with a random experiment, it s said to be Compound Event. When we throw a dice and getting odd number is a compound event.     *        Equally Likely Events more...

*       Introduction   The word 'probability" is one of the most commonly used word in our day to day life. Like probably today will raining, probably India will win the world cup etc. In mathematics, the concept of probability originated in the beginning of eighteenth century in problem of game of chance. Probability is a concept which numerically represents the degree of certainly of the event. Now a days it is widely used as the basic tools of statistics. Science and Engineering.  

*       Mode   Mode is the value that occurs the most of the time in a data or mode is a way of capturing important information about a random variable or a population in a single quantity. The mode is generally different from the mean and median.     *            Model Class In a frequency distribution, the class having maximum frequency is called modal class.     *            Formula for Mode Mode can be calculated by a formula, which is given below: Mode \[={{x}_{k}}+h\left[ \frac{{{f}_{k}}-{{f}_{k-1}}}{2{{f}_{k}}-{{f}_{k-1}}-{{f}_{k+1}}} \right]\] where \[{{x}_{k}}\]= lower limit of the modal class interval. \[{{f}_{k}}\]= frequency of the modal class \[{{f}_{k-1}}\]= frequency of the class preceding the modal class \[{{f}_{k+1}}\]= frequency of the class succeeding the modal class h = width of the class interval       more...

*       Median   Median of a data is the value of the variable which divides it into two equal parts. It means it is the value of variable so that the number of observation above it is equal to the number of observation below it. Suppose\[{{x}_{1}},{{x}_{2}}.....{{x}_{n}}\]are n observation in ascending or descending order. The median of the above observation is: (i) n is odd then median is the value of\[{{\left( \frac{n+1}{2} \right)}^{th}}\] observation. (ii) n is even then median is the value of arithmetic mean of \[{{\left( \frac{n}{2} \right)}^{th}}\]and \[{{\left( \frac{n}{2}+1 \right)}^{th}}\] observation i.e   \[\text{Mean}=\frac{{{\left( \frac{n}{2} \right)}^{th}}\text{observation}+{{\left( \frac{n}{2}+1 \right)}^{th}}\text{observation}}{2}\] Method for finding the median for grouped data. Step for finding the median Step 1: Forgiven frequency distribution, prepare the commutative frequency table and obtain\[N=\sum {{f}_{i}}\]. Step 2: Find (N/2). Step 3: Look at the cumulative frequency Just greater than (N/2) and find the corresponding more...

*       Mean   It is also known as arithmetic mean of a given observation is equal to ratio of sum of observation and total number of observation, i.e. \[\text{Mean }=\frac{\text{Sum of total observation}}{\text{Total Number of observation}}\] If \[{{x}_{1}},{{x}_{2}},.....{{x}_{n}}\] are n observation then its mean                 \[\overline{\text{X}}=\frac{{{x}_{1}}+{{x}_{2}}+.....+{{x}_{n}}}{n}=\frac{\sum {{x}_{i}}}{n}\] The arithmetic mean of grouped data calculated by the following methods: (i) Direct method (ii) Assumed mean method (iii) Step - Deviation method     *            Direct Method In this method, suppose \[{{x}_{1}},{{x}_{2}},.....,{{x}_{n}}\] are the observation having frequency\[{{f}_{1}},{{f}_{2}},.....,{{f}_{n}}\] respectively then \[\overline{\text{X}}=\frac{{{x}_{1}}{{f}_{1}}+{{x}_{2}}{{f}_{2}}+.....,+{{x}_{n}}{{f}_{n}}}{{{f}_{1}}+{{f}_{2}}+.....{{f}_{n}}}=\frac{\sum {{x}_{i}}{{f}_{i}}}{\sum {{f}_{i}}}\]   Direct method for calculating mean depend on the following steps: Step 1: Find the class mark (which is discussed in previous class) for each class. Step 2: Calculate product of frequency and class mark for each class interval. Step 3: Then calculate mean by using formula \[\left( \frac{\sum fixi}{\sum more...

*       Introduction   Previously we have studied about the representation of data. Data handling in an art. It depends upon expertise or it. In this chapter we will emphasis on measure of central tendencies of data.     *       Central Tendencies of Data   We know that statistics is the branch of mathematics which deals with data collected for specific purpose. The central tendency gives us an idea that represents the entire data. There are three types of central tendencies (i) Mean                                               (ii) Median                                          (iii) Mode    

*      Introduction   This is the one of the fundamental concept of "Trigonometry". Trigonometry is the branch of mathematics which deals with the measurement of sides and angles of a triangle. In modern days, its scope has been extended and it also includes the study of polygons and circles.     *       Concept of Angle in Geometry   We know that a line is a geometrical shape which extended infinitely in both directions. Suppose when a point P put anywhere in the above line, it will be converted into rays. These rays are responsible for the formation of an angle means "An angle is a geometrical figure made by two rays having common end point (called vertex)" these rays are called sides or arms of an angle. An angle is represented by S a more...

*       Concept of Angles in Trigonometry   In case of trigonometry, angles may be positive or negative and of any magnitude.       *            Positive Angles When we measure an angle in anti-clock wise direction it is always positive.     *            Negative Angles If an angle measures in anti-clock wise direction then it is said to be negative angle.     *            Different Units of Measurement of an Angle There are three system for measurement of an angle. 1. British System (Sexagesimal System) 2. French System (Centesimal System) 3. Circular Measure or Radian System     British System It is also known as sexagesimal more...

*       Area of Plane Geometrical Figures     *            Area of Plane Figures The area of a plane figure is the measurement of the surface enclosed by its boundry. In this chapter we will study about different plane figures with its area.    Area of Triangle Area of \[\Delta \text{ABC}=\frac{1}{2}\text{BC}\times \text{AD}\] square unit 
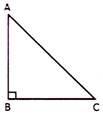
Area of right triangle \[=\frac{1}{2}\times \text{(perpendicular)}\times \text{Base}\] \[=\frac{1}{2}\times AB\times \text{BC}\]     Area of Triangle by Heron's Formula Let a, b, c be the length of sides of a triangle 
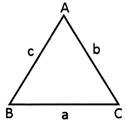
then area \[=\sqrt{s(s-a)(s-b)(s-c)}\]sq. unit where \[s=-\frac{1}{2}(a+b+c)\]     Area of Equilateral Triangle 
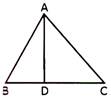
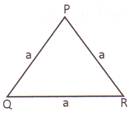
Area \[=\frac{\sqrt{3}}{4}{{(side)}^{2}}=\frac{\sqrt{3}}{4}{{a}^{2}}\] Area of isosceles triangle 
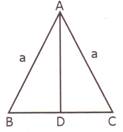
\[=\frac{1}{2}\times more...

*       Circle   We know that circle is locus of a point which moves in plane in such way that its distance from a fixed point is always constant. In this section we will emphasis on sectors, segment etc.     *            Sector of a Circle The region enclosed by an arc of a circle and its two bounding radii, called sector of the circle. In the above given figure. OABC is a sector of the circle with centre 0. Here AC is the minor arc therefore, OABC is the minor sector and other plane sector is the major sector.   Segment A segment of a circle is the region bounded by an arc and a chord. The segment containing minor arc is called a minor segment. While the segment containing the more...


Archive


You need to login to perform this action.
You will be redirected in 3 sec spinner