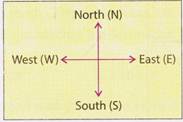
 The sun always rises in the East and sets in the West.
Four Other Directions:
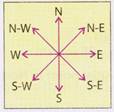
There are four other directions which lie in between the four main directions.
These are: North-East (N-E), North-West (N-W), South-East (S-E), South-West (S-W)
The sun always rises in the East and sets in the West.
Four Other Directions:
There are four other directions which lie in between the four main directions.
These are: North-East (N-E), North-West (N-W), South-East (S-E), South-West (S-W)
 Two Cyclic Directions:
There are two cyclic directions namely clockwise and anticlockwise.
The direction in which the hands of a clock move is called clockwise direction while its opposite direction is called anticlockwise direction as shown below.
Two Cyclic Directions:
There are two cyclic directions namely clockwise and anticlockwise.
The direction in which the hands of a clock move is called clockwise direction while its opposite direction is called anticlockwise direction as shown below.
 (d)
(d)  Explanation (d):
Gas, liquid and solid all the more...
Explanation (d):
Gas, liquid and solid all the more...
 (a)
(a)  (b)
(b)  (c)
(c)  (d)
(d)  Explanation (c):
The black circle in the left side of the more...
Explanation (c):
The black circle in the left side of the more...
 (a)
(a)  (b)
(b)  more...
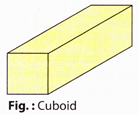 Cube:
Cube is a cuboid which has 6 identical faces.
Cube:
Cube is a cuboid which has 6 identical faces.
 Dice:
A dice is a cube whose each face bears points or numbers from 1 to 6.
Dice:
A dice is a cube whose each face bears points or numbers from 1 to 6.
 EXAMPLE
Count the number of cubes in the following figure.
EXAMPLE
Count the number of cubes in the following figure.
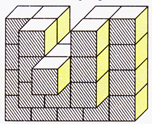 (a) 28 (b) 32
(c) 36 (d) 40
more...
(a) 28 (b) 32
(c) 36 (d) 40
more...
 (a)
(a)  (b)
(b)  (c) more...


You need to login to perform this action.
You will be redirected in
3 sec

