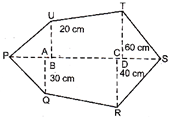
 (a) \[4080\,c{{m}^{2}}\] (b) \[5050\,c{{m}^{2}}\]
(c) \[6060\,c{{m}^{2}}\] (d) \[7070\,c{{m}^{2}}\]
(e) None of these
Answer (b)
Explanation: Area of the given figure
\[=\frac{1}{2}\times 30\times 10+\frac{1}{2}\times 20\times 20+\frac{1}{2}\times 40(30+40)+\frac{1}{2}\times 40\]\[(20+60)+\frac{1}{2}\times 40\times 40\times \frac{1}{2}\times 60\times 30c{{m}^{2}}\]
\[=(150+200+1400+1600+800+900)c{{m}^{2}}\]
\[=5050c{{m}^{2}}\]
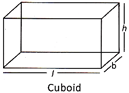
Cuboid and Cube
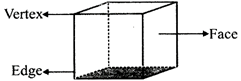
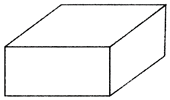
A cuboid is a closed rectangular solid bounded by six rectangular faces. A cuboid has 12 edges and 8 vertices. The length, breadth and height of a cuboid is generally denoted by I, b and h respectively. A cuboid whose length, breadth and height are equal is called a cube and each equal side is called edge of the cube.
(a) \[4080\,c{{m}^{2}}\] (b) \[5050\,c{{m}^{2}}\]
(c) \[6060\,c{{m}^{2}}\] (d) \[7070\,c{{m}^{2}}\]
(e) None of these
Answer (b)
Explanation: Area of the given figure
\[=\frac{1}{2}\times 30\times 10+\frac{1}{2}\times 20\times 20+\frac{1}{2}\times 40(30+40)+\frac{1}{2}\times 40\]\[(20+60)+\frac{1}{2}\times 40\times 40\times \frac{1}{2}\times 60\times 30c{{m}^{2}}\]
\[=(150+200+1400+1600+800+900)c{{m}^{2}}\]
\[=5050c{{m}^{2}}\]
Cuboid and Cube
A cuboid is a closed rectangular solid bounded by six rectangular faces. A cuboid has 12 edges and 8 vertices. The length, breadth and height of a cuboid is generally denoted by I, b and h respectively. A cuboid whose length, breadth and height are equal is called a cube and each equal side is called edge of the cube.

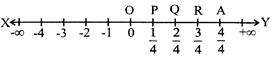
 Co-ordinates of a Point
The pair of points which is used to describe the location of a point in two dimensional system are called co-ordinates of a point. The x-coordinate of a point is horizontal distance of the point from origin and y-coordinate of the point is the vertical distance from the origin.
Line Graph
A line graph is very useful for displaying data or information which changer continuously over a certain period of time. A line graph compares two variables. One variable is plotted along x-axis while another variable is plotted along y-axis.
Linear Graph
A linear graph is a graph which is used to represent the linear relationship between two variables. To draw a linear graph we use co-ordinates along x and y axis. The difference between a line graph Or linear graph is that a line graph display information as a series of points joined by line segments while a linear graph is always a straight line.
Co-ordinates of a Point
The pair of points which is used to describe the location of a point in two dimensional system are called co-ordinates of a point. The x-coordinate of a point is horizontal distance of the point from origin and y-coordinate of the point is the vertical distance from the origin.
Line Graph
A line graph is very useful for displaying data or information which changer continuously over a certain period of time. A line graph compares two variables. One variable is plotted along x-axis while another variable is plotted along y-axis.
Linear Graph
A linear graph is a graph which is used to represent the linear relationship between two variables. To draw a linear graph we use co-ordinates along x and y axis. The difference between a line graph Or linear graph is that a line graph display information as a series of points joined by line segments while a linear graph is always a straight line.
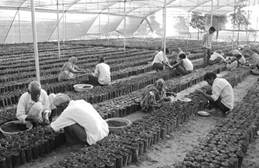 Land preparation and cultivation methodology is among the basic factors which affect the yield of crops. For getting better yield, it is important to prepare land thoroughly, so that the weeds are destroyed and water absorption capacity of the soil is increased.
Crops
When the same kind of plants are grown in the fields on a large scale to obtain foods like cereals, pulses, vegetables and fruits, etc., it is called a crop.
Agriculture
The growing of plants (or crops) in the fields for obtaining food is called agriculture.
Crop production involves various agricultural practices such as:
Land preparation and cultivation methodology is among the basic factors which affect the yield of crops. For getting better yield, it is important to prepare land thoroughly, so that the weeds are destroyed and water absorption capacity of the soil is increased.
Crops
When the same kind of plants are grown in the fields on a large scale to obtain foods like cereals, pulses, vegetables and fruits, etc., it is called a crop.
Agriculture
The growing of plants (or crops) in the fields for obtaining food is called agriculture.
Crop production involves various agricultural practices such as:
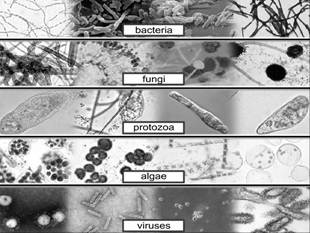 A microorganism or microbe is an organism that is microscopic (usually too small that cannot be seen by the naked human eye). The study of microorganisms is called microbiology.
Microorganisms live in all parts of the biosphere where there is liquid water, including soil, hot springs, on the ocean floor, high in the atmosphere and deep inside rocks within the earth's crust.
Major Groups of Micro-organisms
A microorganism or microbe is an organism that is microscopic (usually too small that cannot be seen by the naked human eye). The study of microorganisms is called microbiology.
Microorganisms live in all parts of the biosphere where there is liquid water, including soil, hot springs, on the ocean floor, high in the atmosphere and deep inside rocks within the earth's crust.
Major Groups of Micro-organisms
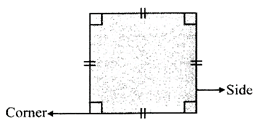 It has four sides and four comers. All its sides are of the same length.
(b) Rectangle.
It has four sides and four comers. All its sides are of the same length.
(b) Rectangle.
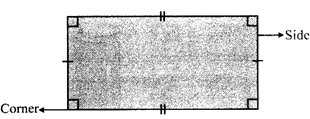 It has four sides and four comers. The opposite sides of a rectangle are parallel and of the same length. Every interior angle is a right \[\angle \]le.
(c) Triangle
It has four sides and four comers. The opposite sides of a rectangle are parallel and of the same length. Every interior angle is a right \[\angle \]le.
(c) Triangle
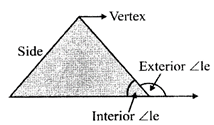 It has three sides and three vertices.
(d) Cuboid
It has three sides and three vertices.
(d) Cuboid
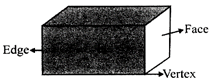 It has 6 flat faces, 12 straight edges and 8 vertices.
(e) Cube
It has 6 flat faces, 12 straight edges and 8 vertices.
(e) Cube
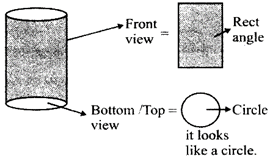
 It has 6 flat faces, 8 vertices and 12 straight edges.
(f) Cylinder
It has 6 flat faces, 8 vertices and 12 straight edges.
(f) Cylinder
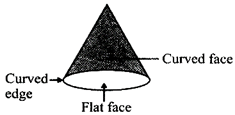
 It has 3 faces \[\to \] 1 curved face and 2 flat faces.
(g) Cone
It has 3 faces \[\to \] 1 curved face and 2 flat faces.
(g) Cone
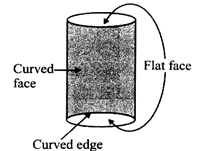
 It has 2 faces \[\to \] 1 curved face and 1 flat face.
It has 1 curved edge.
It has 2 faces \[\to \] 1 curved face and 1 flat face.
It has 1 curved edge.
 (b) An isometric sketch, drawn on an isometric dot paper, which has proportional measurements of the solid.
| S. No. | Name of the figure | more...
NUMBER SYSTEM
FUNDAMENTALS
RATIONAL NUMBERS
FUNDAMENTALS
Rational Number:-
 Operations on Rational Numbers
Current Affairs CategoriesArchive
Trending Current Affairs


You need to login to perform this action. |

