Category : 8th Class
Data Handling
Statistics is the formal science of making effective use of numerical data relating to group of individuals or experiments. It deals with all aspects, including the collection, analysis and interpretation of data and also the planning of the collection of data in terms of the design of surveys and experiments. A statistician is someone who is particularly versed in the ways of thinking necessary for the successful application of statistical analysis. Often such people have gained this experience after starting work in number of fields. This is also a discipline called Mathematical Statistics, which is concerned with the theoretical basis of the subject.
Types of Data
The data may be in the form of raw or grouped. The data which is not arranged in any form is known as the raw data and data which is arranged in a definite pattern is known as the grouped data.is normally classified into two types. Primary data and Secondary data. The primary data is that data which is collected by the person himself for his own personal use, while secondary data is that data which is collected by others and used by someone else for his or her use. It may be data collected form the books, newspaper internet or any other sources.
Pie Chart
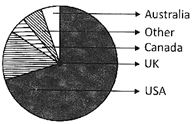
A pie chart is the pictorial representation of the given data with the help of non-intersecting sectors of different areas and different central angles. The magnitude of the central angles depend on the magnitude of the data. In a pie chart, the arc length of each sector and consequently its central angles and area, is directly proportional to the quantity it represents. It is named for its resemblance to a pie which has been sliced. The following pie chart represent the population of English native speakers in different countries.
Co-ordinates of a Point
The pair of points which is used to describe the location of a point in two dimensional system are called co-ordinates of a point. The x-coordinate of a point is horizontal distance of the point from origin and y-coordinate of the point is the vertical distance from the origin.
Line Graph
A line graph is very useful for displaying data or information which changer continuously over a certain period of time. A line graph compares two variables. One variable is plotted along x-axis while another variable is plotted along y-axis.
Linear Graph
A linear graph is a graph which is used to represent the linear relationship between two variables. To draw a linear graph we use co-ordinates along x and y axis. The difference between a line graph Or linear graph is that a line graph display information as a series of points joined by line segments while a linear graph is always a straight line.
The quantity of petrol filled in a can and the cost of petrol are given in the following table. Find the cost of 24litres of petrol using a linear graph.
|
Quantity of petrol (in litres) |
20 |
30 |
40 |
50 |
60 |
|
Cost of petrol (in Rs.) |
1000 |
1500 |
2000 |
2500 |
3000 |
(a) Rs. 1000 (b) Rs. 1200
(c) Rs. 1500 (d) Rs. 2400
(e) None of these
Answer (b)
Explanation: Let us choose the following scale:
On x - axis: 1 cm =10 litres on y - axis 1 cm = Rs. 500
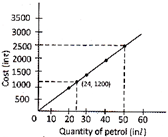
From the above graph we find that the cost of 24 litres of petrol is Rs. 1200.


You need to login to perform this action.
You will be redirected in
3 sec

