Current Affairs 10th Class

  In such type of problems, a set of some figures usually 9 figures is given. This set may be divided into three classes each of 3 figures such that each class has some common properties in its figures. A candidate is required to identify the figures having common properties and then to choose an appropriate option from amongst the given four options.     EXAMPLE     A set of some figures is given. Group these figures into classes on the basis of their common properties and then choose the correct option.   
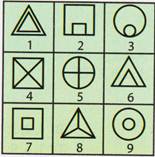
(a) 1, 2, 9; 3, 4, 6; 5, 7, 8                        (b) 1, 7, 9; 2, 3, 6; 4, 5, 8 (c) 1, 7, 8; 2, 9, 3; 6, 4, 5                        (d) 1, 6, 8; 2, 4, 7; 3, 5, 9   Explanation (b): 1, 7, 9; each in a pair of two similar figures one is inside the other but not touching each other. 2, 3, 6; each in a pair of two similar figures one is inside the other and both touching each other. 4, 5, 8; each figure in divided into equal parts by straight lines passing through the centre.  

This chapter leads us with problems on various situations of blocks like as: 1.     Number of blocks in a solid. 2.     Construction of a box/dice. 3.     Identification of a face of a dice.   Types of Questions Ø  To count the total number of blocks in a solid, add the number of blocks in the first (bottom layer, second layer, third layer and so on. Ø  To identify a box formed by folding a given sheet of paper or by its net, focus on the opposite faces of the box. Ø  To identify a face of a particular dice whose different positions are shown, select the common faces and then analyse to find their adjacent and opposite faces. Let us illustrate you by taking examples with explanations.       EXAMPLE   1.         The sheet of paper shown in Fig. (X) is to be folded to form a box.              Choose from the boxes P, Q, R and S that are similar to the box so formed. 
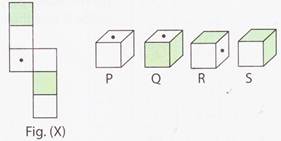
(a) Q and R only                         (b) P, R and S only   (c) Q and S only                         (d) P and S only Explanation (b): When a cube is formed by folding the sheet shown, the face
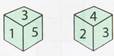
 corner opposite to one of two shaded faces. Also, two white faces lie opposite to each other. All the above conditions are carried by figures P, R and S. So, the correct option is (b).    2.         A dice is thrown two times and its two different positions are given below.              Find the number on the face opposite to the face showing 3.   (a) 2                                          (b) 4               (c) 5                                          (d) 6   Explanation (d): 1, 2, 5, 4 are on the adjacent faces of 3. So, 6 is on the opposite face of 3. \[\therefore \] The answer is (d).  

  Dot situation is a test to confirm a candidate's exactness in sense of various common and uncommon regions to the geometrical figures. In such type of problems a complex figure made up of geometrical figures such as triangle square, rectangle, circle, etc., consisting of one or more dot(s) is provided. A candidate is required to identify a figure from amongst the four options that has the same region(s) (common or uncommon or both) as the region(s) marked by dot(s) in the provider figure.     EXAMPLE     Choose a figure from amongst the four options that has the same conditions of placement:- dots as in Fig. (X). (a)             (b) (c)              (d)      Explanation (d): There are three dots in the given Fig. (X): ·         One dot lies in the region of rectangle only. ·         One dot lies in the region common to circle and rectangle only. ·         One dot lies in the region common to all the three shapes circle, rectangle c-: square.   The figure that has all the situation of placement of the three dots is shown below: Thus, the correct option is (d).  

  In such type of problems, squares and equilateral triangles are constructed by joining its segments. There are three ways of asking questions from this chapter: 1.     To choose the only segment of a square. 2.     To choose three figures that are all the segments of a square. 3.     To choose three figures that are all the segments of an equilateral triangle.     EXAMPLE     1.         Select a figure from the given four options which fits into figure X to form a complete square.   (a)                  (b) (c)                  (d)   Explanation (b): We observe that after rotating the figure (b) through, it exactly fits into figure X to form a complete square as shown below:     2.         Select that combination of the parts P, Q, R, S and T, which can form a complete square when they are mutually fitted into each other.
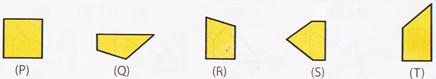
 (a) PRT                         (b) QRS (c) PST                          (d) QRT   Explanation (d):  

This chapter deals with various types of two-dimensional and three-dimensional figures, their formation and their analysis.   Types of Questions Ø  Choose a figure whose components are given. Ø  Identify the components of a given figure. Ø  Formation of a three-dimensional figure from its net. Ø  Identifying an identical figure. Ø  Choosing a pattern with given components.     EXAMPLE    Find out which of the figures (a), (b), (c) and (d) can be formed from the pieces given Fig.(X). (a)                        (b) (c)                      (d)   Explanation (c): Let us join the two smaller pieces as shown below: Now, join it with the third piece as shown below:  

*      Events   The subset E of a sample space is called events. There are different types of events which is defined below:     *          Impossible Events The events which will never occur is called impossible events. The empty set is also called impossible events.     Throwing a dice and getting 7 is an impossible events     *          Sure Events The events which will definitely occur is called sure events.     Throwing a dice and getting 1, 2, 3, 4, 5, or 6 is a sure event     *          Simple Events The events having only one points of the sample space is called simple events. For example, in the experiment of tossing two coins, a sample space is S = {HH, HT, TH, TT}. There are four simple events in this sample space.   *          Compound Events The events having more than one sample points is called compound events. For example, in the experiment of tossing a coin thrice, the events of getting exactly one head, getting at least one head, at most one head are the compound events. {HTT, THT, TTH,}, {HTT, THT, TTH, HHT, HTH, THH, HHH}, {HTT, TTH, TTT}   *          Complementary Events For a event A, the event corresponding to the set of elements excluding the elements of the set A is called complementary events. It is denoted by A" or A7.     *          Mutually Exclusive Events  Two events A and B are said to be mutually exclusive if the occurrence of any one of them excludes the occurrence of the other events or we can say that they cannot occur simultaneously and are considered to be disjoint sets. For example, A = {HTT, THT, TTH, TTT} and B = {HHT, THH, HTH, HHH} are disjoint sets.     *          Exhaustive Events The set of events \[{{E}_{1}},{{E}_{2}},{{E}_{3}}----{{E}_{n}}\] is said to be exhaustive if the sample space is equal to \[S=\bigcup\limits_{k=1}^{n}{{{E}_{k}}}.\] For example. If A = {HTT, THT, TTH, TTT} and B = {HHT, THH, HTH, HHH}, then \[A\cup B\] = {HHT, THH, HTH, HHH, HTT, THT, TTH, TTT}, which is the entire sample space for three toss of a coin.     Event 'A or B' Two events A or B is equivalent to the union of the two events. A or B = \[A\cup B\]     Event 'A and B' Two events A and B is equivalent to the intersection of the two events. A and B = \[A\cap B\]     Event' A but not B': Two events A but not B is denoted as the difference of A and B' denoted by A but not B =\[A\cap {{B}^{/}}\]=A-B     more...

*      Random Experiments   A experiment is said to be a random experiment if it has more than one possible outcome and it is not possible to predict the outcome in advance. For example, throwing a dice or tossing a coin is a random experiment.     *      Outcomes The possible results of a random experiment is called outcomes. For example, throwing a dice and getting 1, 2, 3, 4, 5, 6 are the possible outcomes.     *      Sample Space The set of all possible outcome of a random experiment is called sample space. Each element of the sample space is called sample point. For example, when we throw a dice we get, then it is called sample space.  

*      Introduction   In class previous classes we have studied about the probability as a measure of uncertainity of various phenomenon in our daily life. Normally we obtain the probability of an events as the ratio of the number of favourable outcomes to that of the total possible outcomes. This is called classical theory of probability. Up to class IXth we have studied statistical theory of probability. But the drawback of these theory is that it cannot be applied to the activities which have infinite numbers of outcomes. In this chapter we will study about this approach which is called axiomatic approach of probability. To understand this we have to understand the basic concept.  

*      Mean Deviation       *           Mean Deviation about Mean of a Raw Data Let \[{{x}_{1}},{{x}_{2}}{{x}_{3}},---,{{x}_{n}}\] be the n observation, then the mean of the data is given by: \[\overline{X}=\frac{{{x}_{1}}+{{x}_{2}}+{{x}_{3}}+----+{{x}_{n}}}{n}\] \[\Rightarrow \,\overline{X}\frac{1}{n}\sum\limits_{k=1}^{n}{{{X}_{k}}\Rightarrow \overline{X},=\frac{1}{n}}\sum\limits_{k=1}^{n}{{{X}_{k}}}\] Then the deviation of the data from the mean is given by: \[\left| \left. {{x}_{1}}-\overline{X} \right|,\left| {{x}_{2}},-\left. \overline{X} \right|,\left| \left. {{x}_{3}}-\overline{X} \right|,---,\left| \left. {{x}_{n}}-\overline{X} \right| \right. \right. \right. \right.\] Now the mean deviation of the data is given by: Mean Deviation  \[=\,\Rightarrow M.D.=\frac{1}{n}\sum\limits_{k=1}^{n}{\left| \left. {{X}_{n}}-\overline{X} \right| \right.}\]     *           Mean Deviation about Mean of a Grouped Data Let \[{{x}_{1}},{{x}_{2}},{{x}_{3}},---,{{x}_{n}}\] be the n - observation and \[{{f}_{1}},{{f}_{2}},{{f}_{3}},---{{f}_{n}}\] be the corresponding frequencies of the data. Then the mean of the data is given by:   \[\overline{X}=\frac{{{x}_{1}}{{f}_{1}}+{{x}_{2}}{{f}_{2}}+----+{{x}_{n}}{{f}_{n}}}{{{f}_{1}}+{{f}_{2}}++---+{{f}_{n}}}\,\] Or, \[\overline{X}=\frac{\sum\limits_{k=1}^{n}{{{X}_{k}}}{{f}_{k}}}{\sum\limits_{k=1}^{n}{{{f}_{k}}}}\] Then the mean deviation is given by  \[\Rightarrow \,M.D.=\frac{\sum\limits_{k=1}^{n}{{{f}_{k}}}\left| \left. {{X}_{k}}-\overline{X} \right| \right.}{\sum\limits_{k=1}^{n}{{{f}_{k}}}}\]       *           Mean Deviation about Median of a Ungrouped Data The median of an ungrouped data is obtained by arranging the data in the ascending order. If the number of data is odd, then the median is obtained as \[\left( \frac{n+1}{2} \right)\] term of the data and if the number of data is even, then the median is obtained as: \[\frac{{{\left( \frac{n}{2} \right)}^{th}}+{{\left( \frac{n}{2}+1 \right)}^{th}}}{2}\] If M is the median of the data, then mean deviation is given by \[\Rightarrow \,\,M.D.=\frac{1}{n}\sum\limits_{k=1}^{n}{\left| \left. {{X}_{n}}-M \right| \right.}\]     *           Mean Deviation about Median of a Grouped Data Let \[{{x}_{1}},{{x}_{2}},{{x}_{3}},---,{{x}_{n}}\] be the n -observation and \[{{f}_{1}},{{f}_{2}},{{f}_{3}},---,{{f}_{n}}\] be the corresponding frequencies of the data. Then the mean deviation about the median of the data is given by \[\Rightarrow \,\,M.D.=\frac{\sum\limits_{k=1}^{n}{{{f}_{k}}\left| \left. {{X}_{k}}-M \right| \right.}}{\sum\limits_{k=1}^{n}{{{f}_{k}}}}\] For the grouped data the median can be obtained by Median \[=\,I\,\,+\frac{\frac{N}{2}-C}{f}\times h\]              where,     I = lower limit of the median class      N = sum of all frequency y              C = cumulative frequency of preceding median class h = class width               Find the mean deviation of the data about the mean: 2, 4, 10, 12, 18, 16, 14, 20 (a) 2                                                          (b) 4 (c) 5                                                           (d) 8 (e) None of these     Answer: (c) Explanation The mean of the above data is given by:              \[\overline{X}=\frac{2+4+10+12+18+16+14+20}{8}\]                        \[\overline{X}=12\] Now the deviation about the mean is given by: |2 - 12| = 10,|4 - 12| = 8,|10 ? 12| = 2, |12 - 12| = 0,|18 - 12|= 6,|16 - 12|=4, |14 - 12| = 2,|20 - 12| =8 Now mean deviation about the mean is given by:              \[M.D.=\frac{10+8+2+0+6+4+2+8}{8}\]              \[\Rightarrow \,\,M.D.=\frac{40}{8}=5\]         The score of 10 students of a class test is given as 44, 54, 46, 63, 55, 42, 34, 48, 70, 38. Calculate the mean deviation about the median. (a) 8.6                                       more...

*      Introduction   Statistics is that branch of mathematics which deals with the collection and interpretation of data. The data may be represented in different graphical forms such as bar graphs, histogram, ogive curve, and pie chart. This representation of data reveals certain salient features of the data. These values of the data is called measure of central tendency. The various measure of central tendencies are mean, median and mode. A measure of central tendency gives us the rough idea of where data points are centered. But in order to make more accurate interpretation of central values of the data we should also have an idea of how the data are scattered around the measure of central tendency. Thus we can say that the measure of central tendency is not sufficient to give the complete information about a given data. There is another factor which is required to be studied under the statistics is the variability of the data. This variability of data is called measure of dispersion. Thus the important measure of dispersion is the mean deviation from mean or median. We have discussed about the various method of calculating mean, median, and mode in class IXth. In this chapter we shall discuss about the various methods of calculating deviation about mean and median of the data. We will also discuss about the variance and standard deviation of the data.  


You need to login to perform this action.
You will be redirected in 3 sec spinner