Bar Graph
Category : 4th Class
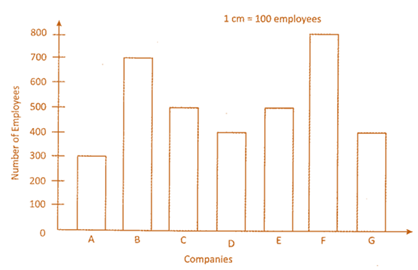
When the data is represented on the graph using bars the graph is known as Bar graph. In the following table, number of employee in different companies has been shown.
| Company | Number of employee |
| Company A | 300 |
| Company B | 700 |
| Company C | 500 |
| Company D | 400 |
| Company E | 500 |
| Company F | 800 |
| Company G | 400 |
Let us make a bar graph using above information:
Step 1: Draw a horizontal and a vertical line.
Step 2: Choose a convenient scale and mark the numbers on the vertical line at equal interval (if you want to draw horizontal graphs mark the numbers on the horizontal line).
Step 3: Now make bars, keeping width of the bars and distance between the bars equal. Length (height) of the bars represents respective observations.
![]()
Read the given bar graph and answer the following question:
(a) How many students are there in class iv?
(b) Find the difference in the number of students of class v and class iv
(c) In which class is there least number of students
Explanation
(a) The bar of class iv represents 125 students 25 There for number of student is class iv = 125
(b) Number of students in class v = 150 Number of students in class iv =125 Difference = 150 - 125 = 25
(c) Bar of the class iii has greatest length. Therefore, class iii has maximum number of students.
![]()
DID YOU KNOW?

![]() With the help of given information. Marry wants to make a Pictograph. She choose the scale
With the help of given information. Marry wants to make a Pictograph. She choose the scale
![]() .
.
| Days | Temperature |
| Monday | |
| Tuesday | |
| Wednesday | |
| Thursday | |
| Friday | |
| Saturday | |
| Sunday |
How many should he placed for the Saturday in the pictograph?
(a) 2
(b) 3
(c) 4
(d) 5
(e) None of these
Answers (a)
Explanation-
one represents
![]() temperature. Therefore, 4
temperature. Therefore, 4 should be placed for the Saturday in the pictograph.
![]() Read the given information and answer what does symbol of bat stand for?
Read the given information and answer what does symbol of bat stand for?
| Player | Score |
| Sachin | 100 |
| Ponting | 125 |
| Gibbs | 150 |
| Herris | 75 |
| Sachin | |
| Ponting | |
| Gibbs | |
| Harris |
(a) ![]() stands for 20 runs
stands for 20 runs
(b) ![]() stands for 25 runs
stands for 25 runs
(c)![]() stands for 30 runs
stands for 30 runs
(d)![]() stands for 35 runs
stands for 35 runs
(e) None of these
Answer (b)
![]() In the following figure, a pictograph has been shown. In which number of students present in the class in different days of a week has been shown. Find the total number of students present in the class on Monday and Thursday together.
In the following figure, a pictograph has been shown. In which number of students present in the class in different days of a week has been shown. Find the total number of students present in the class on Monday and Thursday together.
| Monday | |
| Tuesday | |
| Wednesday | |
| Thursday | |
| Friday | |
| Saturday |
(One represents 20 students)
(a) 120
(b) 240
(c) 160
(d) 260
(e) None of these
Answer (d)
![]() If we make a bar graph using the information given in the question 2 by selecting the scale 1 cm = 25 runs, what will be the length of the graph which represents run scored by Sachin?
If we make a bar graph using the information given in the question 2 by selecting the scale 1 cm = 25 runs, what will be the length of the graph which represents run scored by Sachin?
(a) 4cm
(b) 5cm
(c) 6cm
(d) 7cm
(e) None of these
Answer (a)


You need to login to perform this action.
You will be redirected in
3 sec

