Data Handling
Category : 4th Class
LEARNING OBJECTIVES
This lesson will help you to:—
Real Life Example
QUICK CONCEPT REVIEW
Diagrams/pictures
Data handling is a process of collection organization and representation of data in various forms. Data is | collected from different sources: then the collected data is organized in order to record it for further use. The recorded data is then represented using graphs and charts.
Process of Data Handing
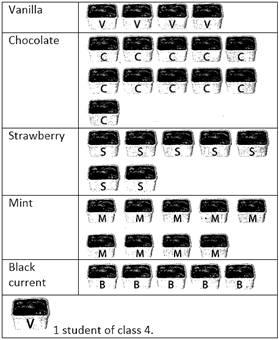
Favourite ice-cream of students of class 4.
Step 1: Collection of data
Ask each student about their favourite ice cream and note down in you notebook.
Step 2: Organization of data
For organization of data use tally marks against each ice cream and prepare a table.
Use of tally marks:
Write ‘I’ for 1 student against the ice-cream.
Write ‘II’ for 2 student against the ice-cream.
Write ‘III' for 3 student against the ice-cream.
Write "IIII' for 4 student against the ice-cream.
Write’\[\cancel{|||||}\]’for 5 student against the ice-cream.
Write '\[\cancel{|||||}|\]' for 6 student against the ice-cream.
Write '\[\cancel{|||||}||\]' for 7 student against the ice-cream.
Write '\[\cancel{|||||}|||\]' for 8 student against the ice-cream.
Write '\[\cancel{|||||}||||\]' for 9 student against the ice-cream.
Write '\[\cancel{|||||}\cancel{|||||}\]' for 10 student against the ice-cream.
For example:
|
Ice-cream |
Tally marks |
Number of students |
|
Vanilla |
\[||||\] |
4 |
|
Chocolate |
\[\cancel{||||}\cancel{||||}|\] |
11 |
|
Strawberry |
\[\cancel{||||}||\] |
7 |
|
Mint |
\[\cancel{||||}||||\] |
9 |
|
Black current |
\[\cancel{||||}\] |
5 |
Step 3: Recording the data
For recording the data prepare a table for the ice-cream and number of students who likes that ice-cream.
|
Ice-cream |
Number of students |
|
Vanilla |
4 |
|
Chocolate |
11 |
|
Strawberry |
7 |
|
Mint |
9 |
|
Black current |
5 |
Amazing Facts
Data handling is also known as statistics.
The horizontal and vertical lines in the bar graph is called axes of bar graph.
Historical Preview
Step 4: Representation of data
Data is represented using graphs and charts. Here, we would show you representation of data through:
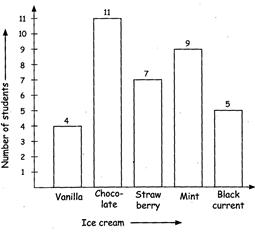
B. Representation of data using bar graph (Refer Table 2)
1. Representation of data using Pie-chart
Consider the following data: There are 20 students in class 4. Out of them 5 like vanilla ice-cream and rest of them does not like vanilla ice-cream.
i.e.,\[\frac{5}{20}\]students of class 4 likes vanilla ice cream.
\[\therefore \]The pie-chart becomes
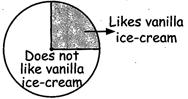
Students of class 4
Thus, using the above given four steps one can perform the task of data handling for various forms of data available in various sources.
Misconcept/Concept
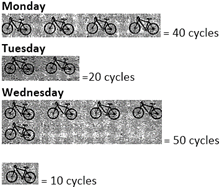
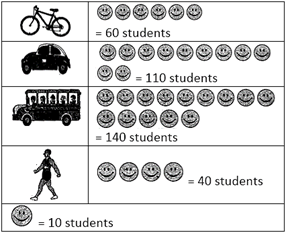
Misconcept: The number of pictures in a pictograph represents the frequency and one picture means 1 object.
Concept: The number of pictures in a pictograph represents the frequency but one picture does not always represent 1 object.
For example: Number of cycles sold in 3 days.
Shortcut to problem solving
Examples:
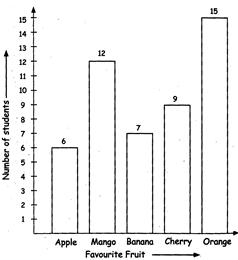
2. A bar graph showing number of students and their favourite fruit.


You need to login to perform this action.
You will be redirected in
3 sec

