4th Class Mathematics Data Handling Handling data

Handling data

Category : 4th Class

Handling Data


Synopsis


  • A collection of numbers or facts gathered for some specific purpose is called data.
  • Interpreting the collected data gives us information.
  • The data collected is organised and represented in pictorial form such as tables and graphs.
  • A graph is a pictorial representation of data that gives a lot of information clearly.


  • Some kinds of graphs:


(i) Bar graph               

(ii) Pictograph  

(iii) Pie chart etc.


  • A pictograph has pictures or symbols to represent information.
  • A pictograph has a title and gives the definition of the symbol.
  • Pictographs enable us to compare information and understand facts better.
  • A bar graph also helps us compare the information and understand it better. It is also called a column graph.
  • Every bar graph must have,

(i) a title that explains the information given in the graph.

(ii) the scales on the horizontal and vertical axes.

(iii) labels on the axes.

  • Circle charts are also used to represent data and compare information.
  • In a circle graph, information is represented in different parts of the circle depending on the size of information.


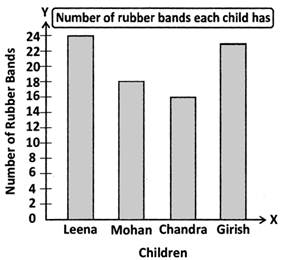
(1-5): The graph shows the number of rubber bands each child has.


Other Topics

Notes - Handling Data


You need to login to perform this action.
You will be redirected in 3 sec spinner