0
question_answer1) The graph shows the variation in magnetic flux \[\varphi (t)\] with time through a coil. Which of the statements given below is not correct [AMU (Engg.) 2001]
question_answer2) The variation of induced emf (E) with time (t) in a coil if a short bar magnet is moved along its axis with a constant velocity is best represented as [IIT-JEE (Screening) 2004]
question_answer3) The current through a 4.6 H inductor is shown in the following graph. The induced emf during the time interval t = 5 milli-sec to 6 milli-sec will be
question_answer4) An alternating current of frequency 200 rad/sec and peak value 1A as shown in the figure, is applied to the primary of a transformer. If the coefficient of mutual induction between the primary and the secondary is 1.5 H, the voltage induced in the secondary will be
question_answer5) A horizontal loop abcd is moved across the pole pieces of a magnet as shown in fig. with a constant speed v. When the edge ab of the loop enters the pole pieces at time t = 0 sec. Which one of the following graphs represents correctly the induced emf in the coil
question_answer6) Some magnetic flux is changed from a coil of resistance 10 ohm. As a result an induced current is developed in it, which varies with time as shown in figure. The magnitude of change in flux through the coil in webers is
question_answer7) The graph gives the magnitude B(t) of a uniform magnetic field that exists throughout a conducting loop, perpendicular to the plane of the loop. Rank the five regions of the graph according to the magnitude of the emf induced in the loop, greatest first
question_answer8) Figure (i) shows a conducting loop being pulled out of a magnetic field with a speed v. Which of the four plots shown in figure (ii) may represent the power delivered by the pulling agent as a function of the speed v
question_answer9) A rectangular loop is being pulled at a constant speed v, through a region of certain thickness d, in which a uniform magnetic field B is set up. The graph between position x of the right hand edge of the loop and the induced emf E will be
question_answer10) The current i in an inductance coil varies with time, t according to the graph shown in fig. Which one of the following plots shows the variation of voltage in the coil with time [CBSE PMT 1994]
question_answer11) When a battery is connected across a series combination of self-inductance L and resistance R, the variation in the current i with time t is best represented by [MP PET 2004]
question_answer12) When a certain circuit consisting of a constant e.m.f. E an inductance L and a resistance R is closed, the current in, it increases with time according to curve 1. After one parameter (E, L or R) is changed, the increase in current follows curve 2 when the circuit is closed second time. Which parameter was changed and in what direction
question_answer13) A flexible wire bent in the form of a circle is placed in a uniform magnetic field perpendicular to the plane of the coil. The radius of the coil changes as shown in figure. The graph of induced emf in the coil is represented by
question_answer14) The current i in an induction coil varies with time t according to the graph shown in figure. Which of the following graphs shows the induced emf (e) in the coil with time
question_answer15) In an L?R circuit connected to a battery the rate at which energy is stored in the inductor is plotted against time during the growth of the current in the circuit. Which of the following best represents the resulting curve
question_answer16) Switch S of the circuit shown in figure. is closed at t = 0. If e denotes the induced emf in L and i, the current flowing through the circuit at time t, which of the following graphs is correct
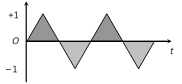
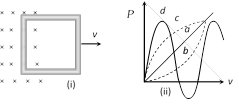
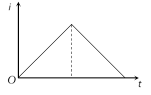
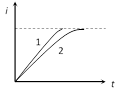
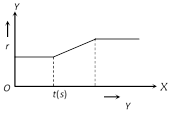
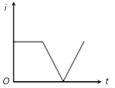
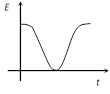
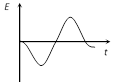
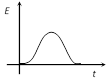
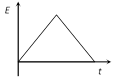
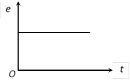
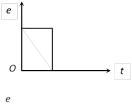
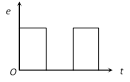
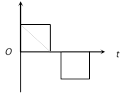
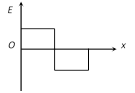
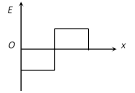
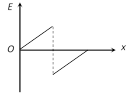
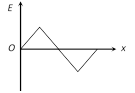
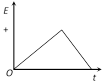
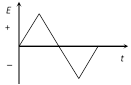
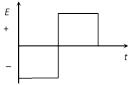
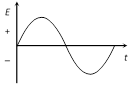
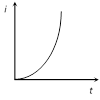
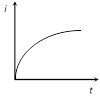
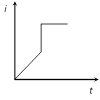
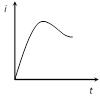
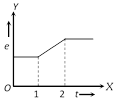
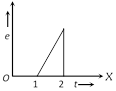
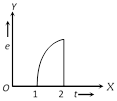
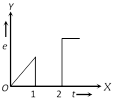
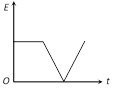
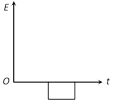
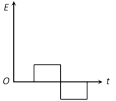
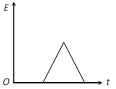
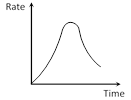
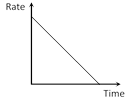
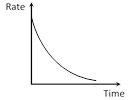
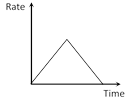
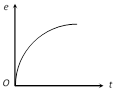
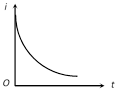
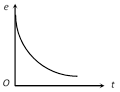
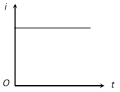
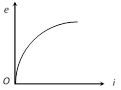
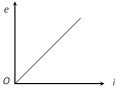
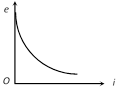
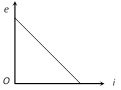
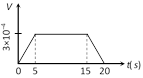
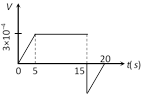
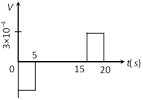
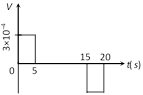
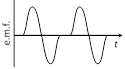
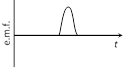
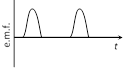
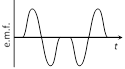
question_answer17) For previous objective, which of the following graphs is correct
question_answer18) A square loop of side 5 cm enters a magnetic field with 1 cms-1. The front edge enters the magnetic field at t = 0 then which graph best depicts emf
question_answer19) A magnet is made to oscillate with a particular frequency, passing through a coil as shown in figure. The time variation of the magnitude of e.m.f. generated across the coil during one cycle is [AIIMS 2005]
Please Wait you are being redirected....
You need to login to perform this action.You will be redirected in 3 sec
OTP has been sent to your mobile number and is valid for one hour
Your mobile number is verified.