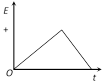
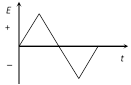
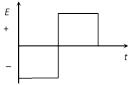
JEE Main & Advanced Physics Electro Magnetic Induction Question Bank Graphical Questions

  • question_answer
    The current i in an inductance coil varies with time, t according to the graph shown in fig. Which one of the following plots shows the variation of voltage in the coil with time                                               [CBSE PMT 1994]

    A)                                    

    B)                   

    C)                          

    D)                  

    Correct Answer: C

    Solution :

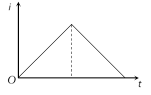
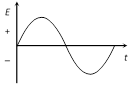
                       According to i ? t graph, in the first half current is in-creasing uniformly so a constant negative emf induces in the circuit.      In the second half current is decreasing uniformly so a constant positive emf induces Hence graph (c) is correct


You need to login to perform this action.
You will be redirected in 3 sec spinner