-
question_answer1)
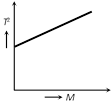
The graph shown was obtained from experimental measurements of the period of oscillations T for different masses M placed in the scale pan on the lower end of the spring balance. The most likely reason for the line not passing through the origin is that the [NCERT 1978]
A)
Spring did not obey Hooke's Law done
clear
B)
Amplitude of the oscillations was too large done
clear
C)
Clock used needed regulating done
clear
D)
Mass of the pan was neglected done
clear
View Solution play_arrow
-
question_answer2)
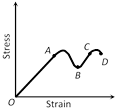
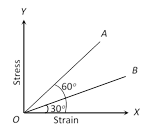
A graph is shown between stress and strain for a metal. The part in which Hooke's law holds good is
A)
OA done
clear
B)
AB done
clear
C)
BC done
clear
D)
CD done
clear
View Solution play_arrow
-
question_answer3)
In the above graph, point B indicates
A)
Breaking point done
clear
B)
Limiting point done
clear
C)
Yield point done
clear
D)
None of the above done
clear
View Solution play_arrow
-
question_answer4)
In the above graph, point D indicates
A)
Limiting point done
clear
B)
Yield point done
clear
C)
Breaking point done
clear
D)
None of the above done
clear
View Solution play_arrow
-
question_answer5)
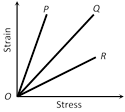
The strain-stress curves of three wires of different materials are shown in the figure. P, Q and R are the elastic limits of the wires. The figure shows that
A)
Elasticity of wire P is maximum done
clear
B)
Elasticity of wire Q is maximum done
clear
C)
Tensile strength of R is maximum done
clear
D)
None of the above is true done
clear
View Solution play_arrow
-
question_answer6)
The diagram shows a force-extension graph for a rubber band. Consider the following statements[AMU 2001]
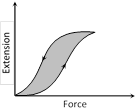
It will be easier to compress this rubber than expand it Rubber does not return to its original length after it is stretched The rubber band will get heated if it is stretched and released Which of these can be deduced from the graph
A)
III only done
clear
B)
II and III done
clear
C)
I and III done
clear
D)
I only done
clear
View Solution play_arrow
-
question_answer7)
The stress versus strain graphs for wires of two materials A and B are as shown in the figure. If \[{{Y}_{A}}\] and \[{{Y}_{B}}\] are the Young ?s modulii of the materials, then [Kerala (Engg.) 2001]
A)
\[{{Y}_{B}}=2{{Y}_{A}}\] done
clear
B)
\[{{Y}_{A}}={{Y}_{B}}\] done
clear
C)
\[{{Y}_{B}}=3{{Y}_{A}}\] done
clear
D)
\[{{Y}_{A}}=3{{Y}_{B}}\] done
clear
View Solution play_arrow
-
question_answer8)
The load versus elongation graph for four wires of the same material is shown in the figure. The thickest wire is represented by the line [KCET 2001]
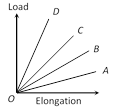
A)
OD done
clear
B)
OC done
clear
C)
OB done
clear
D)
OA done
clear
View Solution play_arrow
-
question_answer9)
The adjacent graph shows the extension \[(\Delta l)\] of a wire of length 1m suspended from the top of a roof at one end with a load W connected to the other end. If the cross sectional area of the wire is \[{{10}^{-6}}{{m}^{2}},\] calculate the young?s modulus of the material of the wire [IIT-JEE (Screening) 2003]
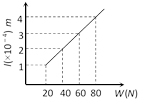
A)
\[2\times {{10}^{11\,}}N/{{m}^{2}}\] done
clear
B)
\[2\times {{10}^{-11}}N/{{m}^{2}}\] done
clear
C)
\[3\times {{10}^{-12}}N/{{m}^{2}}\] done
clear
D)
\[2\times {{10}^{-13}}N/{{m}^{2}}\] done
clear
View Solution play_arrow
-
question_answer10)
The graph is drawn between the applied force F and the strain (x) for a thin uniform wire. The wire behaves as a liquid in the part [CPMT 1988]
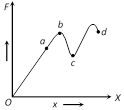
A)
ab done
clear
B)
bc done
clear
C)
cd done
clear
D)
oa done
clear
View Solution play_arrow
-
question_answer11)
The graph shows the behaviour of a length of wire in the region for which the substance obeys Hook?s law. P and Q represent [AMU 2001]

A)
P = applied force, Q = extension done
clear
B)
P = extension, Q = applied force done
clear
C)
P = extension, Q = stored elastic energy done
clear
D)
P = stored elastic energy, Q = extension done
clear
View Solution play_arrow
-
question_answer12)
The potential energy U between two molecules as a function of the distance X between them has been shown in the figure. The two molecules are [CPMT 1986, 88, 91]
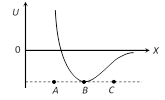
A)
Attracted when x lies between A and B and are repelled when X lies between B and C done
clear
B)
Attracted when x lies between B and C and are repelled when X lies between A and B done
clear
C)
Attracted when they reach B done
clear
D)
Repelled when they reach B done
clear
View Solution play_arrow
-
question_answer13)
The value of force constant between the applied elastic force F and displacement will be
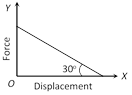
A)
\[\sqrt{3}\] done
clear
B)
\[\frac{1}{\sqrt{3}}\] done
clear
C)
\[\frac{1}{2}\] done
clear
D)
\[\frac{\sqrt{3}}{2}\] done
clear
View Solution play_arrow
-
question_answer14)
The diagram shows stress v/s strain curve for the materials A and B. From the curves we infer that [AIIMS 1987]
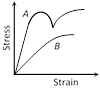
A)
A is brittle but B is ductile done
clear
B)
A is ductile and B is brittle done
clear
C)
Both A and B are ductile done
clear
D)
Both A and B are brittle done
clear
View Solution play_arrow
-
question_answer15)
Which one of the following is the Young?s modulus (in N/m2) for the wire having the stress-strain curve shown in the figure
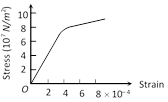
A)
\[24\times {{10}^{11}}\] done
clear
B)
\[8.0\times {{10}^{11}}\] done
clear
C)
\[10\times {{10}^{11}}\] done
clear
D)
\[2.0\times {{10}^{11}}\] done
clear
View Solution play_arrow
-
question_answer16)
The diagram shows the change x in the length of a thin uniform wire caused by the application of stress F at two different temperatures T1 and T2. The variations shown suggest that [CPMT 1988]
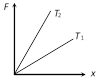
A)
\[{{T}_{1}}>{{T}_{2}}\] done
clear
B)
\[{{T}_{1}}<{{T}_{2}}\] done
clear
C)
\[{{T}_{1}}={{T}_{2}}\] done
clear
D)
None of these done
clear
View Solution play_arrow
-
question_answer17)
A student plots a graph from his reading on the determination of Young?s modulus of a metal wire but forgets to label. The quantities on X and Y axes may be respectively.

A)
Weight hung and length increased done
clear
B)
Stress applied and length increased done
clear
C)
Stress applied and strain developed done
clear
D)
Length increased and weight hung done
clear
View Solution play_arrow
-
question_answer18)
The points of maximum and minimum attraction in the curve between potential energy (U) and distance (r)of a diatomic molecules are respectively
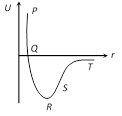
A)
Sand R done
clear
B)
T and S done
clear
C)
R and S done
clear
D)
S and T done
clear
View Solution play_arrow
-
question_answer19)
The stress-strain curves for brass, steel and rubber are shown in the figure. The lines A, B and C are for

A)
Rubber, brass and steel respectively done
clear
B)
Brass, steel and rubber respectively done
clear
C)
Steel, brass and rubber respectively done
clear
D)
Steel, rubber and brass respectively done
clear
View Solution play_arrow


