JEE Main & Advanced Physics Elasticity Question Bank Graphical Questions

  • question_answer
    The diagram shows the change x in the length of a thin uniform wire caused by the application of stress F at two different temperatures T1 and T2. The variations shown suggest that                           [CPMT 1988]

    A)             \[{{T}_{1}}>{{T}_{2}}\]

    B)             \[{{T}_{1}}<{{T}_{2}}\]

    C)             \[{{T}_{1}}={{T}_{2}}\]

    D)             None of these

    Correct Answer: A

    Solution :

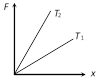
        Elasticity of wire decreases at high temperature i.e. at higher temperature slope of graph will be less. So we can say that \[{{T}_{1}}>{{T}_{2}}\]        


You need to login to perform this action.
You will be redirected in 3 sec spinner