Data Analysis
Category :
Data Analysis
It can be classified into two parts i.e.,
· Statistics
· Data Interpretation
STATISTICS
Statistics is the branch of mathematics which deals with the collection, analysis and interpretation of numerical data.
Frequency Distribution or Frequency Table
If data is classified in a convenient way and presented in a table, it is called frequency table and or frequency distribution.
Terms Related to Frequency Distribution
Frequency When the data is presented in a frequency table, the number of observations that fall in any particular class is called the frequency of that class.
Class-limit The starting and end values of each class are called 'lower limit' and 'upper limit' of that class respectively.
Class-interval The difference between the upper and lower boundaries of a class is called the 'class-interval or size of the class'. It can also be defined as the difference between the lower or upper limits or boundaries of two consecutive classes.
Class-boundaries The average of the upper limit of a class and the lower limit of the succeeding class is called the 'upper boundary' of that class. The upper boundary of a class becomes the 'lower boundary' of the next class.
Range The difference between the highest and the lowest observation of a data is called its range.
Graphical Representation of Frequency Distribution
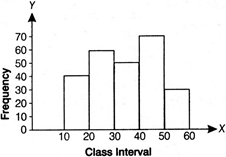
Histogram Pertaining to a frequency distribution, if the true limits of the classes are taken on the X-axis and the corresponding frequencies on the Y-axis and adjacent rectangles are drawn, the diagram is called histogram.
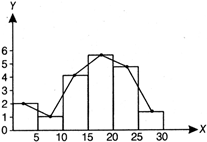
Frequency Polygon and Frequency Curve If the points pertaining to the mid-values of the classes of a frequency distribution and the corresponding frequencies are plotted on a graph sheet and these points are joined by straight lines, the figure formed is called a frequency polygon. If these points are joined by a smooth curve, the figure formed is called frequency curve.
Cumulative Frequency Curves If the points pertaining to the boundaries of the classes of a frequency distribution and the corresponding cumulative frequencies are plotted on a graph sheet and they are joined by a smooth curve, the figure formed is called a cumulative frequency curve.
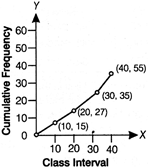
The figure formed with upper boundaries of the classes and the corresponding less than cumulative frequencies is called less than cumulative frequency curve. The figure formed with lower boundaries of the classes and the corresponding greater than cumulative frequencies is called greater than cumulative frequency curve.
Arithmetic Mean (AM) or Mean
Arithmetic Mean of Ungrouped Data
If \[{{x}_{1}},\]\[{{x}_{2}},\]\[{{x}_{3}},\]\[...,\]\[{{x}_{n}}\]are n values of a variable x, then arithmetic mean x is denned as \[=\frac{{{x}_{1}}+{{x}_{2}}+{{x}_{3}}+...+{{x}_{n}}}{n}\]
or \[\overline{x}=\frac{\sum\limits_{i=1}^{n}{{{x}_{i}}}}{n}\]
where, \[\sum\limits_{i=1}^{n}{{{x}_{i}}}=({{x}_{1}}+{{x}_{2}}+{{x}_{3}}+...+{{x}_{n}})\]
Arithmetic Mean of Grouped Data
Here, the mean may be computed by the following method
Direct Method If \[{{x}_{1}},\]\[{{x}_{2}},\]\[{{x}_{3}},\]\[...,{{x}_{n}}\]are n values of a variable x and \[{{f}_{1}},\]\[{{f}_{2}},\]\[{{f}_{3}},\]\[...,{{f}_{n}}\]are the corresponding frequencies, then
\[\bar{x}=\frac{{{f}_{1}}{{x}_{1}}+{{f}_{2}}{{x}_{2}}+...+{{f}_{n}}{{x}_{n}}}{{{f}_{1}}+{{f}_{2}}+{{f}_{3}}+...+{{f}_{n}}}\]
or \[\bar{x}=\frac{\sum\limits_{i=1}^{n}{{{f}_{i}}}{{x}_{i}}}{n}\]
Where, \[\sum\limits_{i-1}^{n}{{{f}_{i}}{{x}_{i}}}={{f}_{1}}+{{x}_{1}}+{{f}_{2}}{{x}_{2}}+...+{{f}_{n}}{{x}_{n}}\]
and \[N={{f}_{1}}+{{f}_{2}}+{{f}_{3}}+...+{{f}_{n}}\]
1. Find the AM from the following data.
|
Class Interval |
0-10 |
10-20 |
20-30 |
30-40 |
40-50 |
50-60 |
|
frequency |
5 |
7 |
12 |
8 |
4 |
2 |
Sol.
|
Class interval |
Mid value \[{{x}_{i}}\] |
Frequency \[{{f}_{i}}\] |
\[{{f}_{i}}{{x}_{i}}\] |
|
0-10 |
5 |
5 |
25 |
|
10-20 |
15 |
7 |
105 |
|
20-30 |
25 |
12 |
300 |
|
30-40 |
35 |
8 |
280 |
|
40-50 |
45 |
4 |
180 |
|
50-60 |
55 |
2 |
110 |
|
Total |
|
38 |
1000 |
\[AM=\overline{x}=\frac{\sum{{{f}_{i}}{{x}_{i}}}}{\sum{f}}=\frac{1000}{38}=26.31\]
Median
Median of Ungrouped Data
If \[{{x}_{1}},\]\[{{x}_{2}},...,\]\[{{x}_{n}}\]are n values of variable x arranged in order of increasing or decreasing magnitude, then the middle-most value in this arrangement is called the median.
If re is odd, then the median will be the \[\left( \frac{n+1}{2} \right)\text{th}\] value
arranged in order of magnitude. In this case, there will be one and only one value of the median.
If n is even, then the data arranged in order of magnitude, will have 2 middle-most values, i.e., \[\left( \frac{n}{2} \right)\text{th}\] and \[\left( \frac{n}{2}+1 \right)\text{th}\]values.
\[\text{Median}=\frac{\begin{align}
& \text{Value of}~\left( \frac{n}{2} \right)\text{th observation} \\
& +\text{ Value of}~\left( \frac{n}{2}+1 \right)\text{th observation} \\
\end{align}}{2}\]
Median of Grouped Data
If N is the number of observation, we first calculate \[\frac{N}{2}.\]
Then, from the cumulative frequency distribution, we determine the class in which \[\left( \frac{N}{2} \right)\text{th}\] observation lies. Let name this as the median-class. We use the following formula for calculating the median
Median \[(M)=l+\left\{ \frac{\frac{N}{2}-F}{f} \right\}\times C\]
Where, l = lower boundary of the median class i.e., the class where the \[\left( \frac{N}{2} \right)\text{th}\] observation lies.
N = Total frequency
F = Cumulative frequency of a class preceding the median class
f = Frequency of the median class
C = Length of the class interval
2. Find the median of the given data.
|
Age (years) |
10 |
11 |
12 |
13 |
14 |
15 |
16 |
17 |
|
Number of students |
2 |
10 |
18 |
20 |
10 |
7 |
6 |
3 |
Sol.
|
Age (in years) x |
Number of student f |
Cumulative frequency cf |
|
10 |
2 |
2 |
|
11 |
10 |
12 |
|
12 |
18 |
30 |
|
13 |
20 |
50 |
|
14 |
10 |
60 |
|
15 |
7 |
67 |
|
16 |
6 |
73 |
|
17 |
3 |
76 |
|
Total |
N = 76 |
|
Here, \[N=76\]\[\Rightarrow \]\[\frac{N}{2}=38\]
We find that the cumulative frequency just greater than 38 is 50 and value of x corresponding to 50 is 13.
Median =13
Mode
The mode or modal value of a distribution is that value of the variable for which the frequency is maximum.
For a given data, mode may or may not exist.
If mode exists for a given data, it may or may not be unique. Data having unique mode is called uni-modal. While the data having two modes is called bi-modal.
Mode of an Ungrouped Data
Observation with the highest frequency becomes the mode of the data.
Mode of Grouped Data
Mode\[=l+\frac{(f-{{f}_{1}})C}{2f-{{f}_{1}}-{{f}_{2}}}\]
Where,
\[l\]= Lower boundary of the modal class
\[f\]= Frequency of the modal class
\[{{f}_{1}}\]= Frequency of the class preceding the modal class
\[{{f}_{2}}\]= Frequency of the class following the modal
class
\[C\]= Length of the class-interval.
Relation between Mean, Median and Mode
3 (Median) \[-2\](Mean) = Mode
3. Find the mode for given distribution.
|
Class interval |
25-30 |
30-35 |
35-40 |
40-45 |
45-50 |
50-55 |
|
frequency |
20 |
53 |
42 |
42 |
41 |
33 |
Sol.
|
Class interval |
frequency |
Cumulative frequency |
|
25-30 |
20 \[{{f}_{1}}\] |
20 \[{{f}_{1}}\] |
|
30-35 |
53 \[f\] |
73 \[f\] |
|
35-40 |
42 \[{{f}_{2}}\] |
115 \[{{f}_{2}}\] |
|
40-45 |
42 |
157 |
|
45-50 |
41 |
198 |
|
50-55 |
33 |
231 |
The greatest frequency 53 lies in the class \[30-35.\]
\[\therefore \] \[30-35\]is the modal class.
Therefore, \[l=30,\]\[f=53,\]\[{{f}_{1}}=20,\]\[{{f}_{2}}=42\]and \[C=5\]
Mode \[=l+\frac{f-{{f}_{1}}}{2f-{{f}_{1}}-{{f}_{2}}}\times C=30+\frac{53-20}{2\times 53-20-42}\times 5\]
\[=30+3.75=33.75\]
DATA INTERPRETATION
The process of deriving conclusion or inferences from the information given in an organized format of data is called data interpretation.
Different Format of Presentation of Data
· Table
· Bar Graph
· Pie Chart
· Line Graph
Table
In data table, data are arranged systematically in rows and columns. We must read the information and data table carefully to answer the questions which are asked on it.
Some examples are given below to understand it properly.


You need to login to perform this action.
You will be redirected in
3 sec

