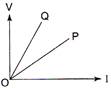
A) Resistance of P is grater than that of Q
B) Resistance of P is less than that of Q
C) Resistance of P is equal to the resistance of Q
D) Nothing can be decided about the resistances of P and Q
Correct Answer: B
Solution :
[b] Resistance of a conductor = Slope of the graph between V and I Since, the slope of Q is more than the slope of P, the resistance of Q is more than the resistance of P.


You need to login to perform this action.
You will be redirected in
3 sec

