Structure of Economy and Human Resource in India
Category : UPSC
Structure of Economy and Human Resource in India
Introduction
The word ?Economies? has originated from the Greek word 'Oikonomikos'; Oikos (Home)+Nomos (Management) together means 'Home Management'. Economics is a broad term referring to the scientific study of human action, particularly as it relates to human choice and the utilization of scarce resources. It includes the theories, principles, and models that deal with how the market process works. The world 'Economy' refers to an entire network of producers, distributors, and consumers of goods and services in a local, regional, or national community.
Economic Growth & Development
Increase in per capita real income in a country over a long period of time is the 'economic growth.' Economic development is defined as sustained increase in production (GDP or GNP) at 5 to 7 percent rate as well as change in the structure of the economy and also occupational structure of the economy. It should be accompanied with reduction of poverty, inequality and unemployment.
According to Kindleberger, economic growth means increase in production only while economic development is a wider concept and it means improvement in technology employed in production, distribution system and institutional system etc.
But economic development is not possible without economic growth. Underdeveloped economies, with limited technological and economic resources, cannot eliminate poverty, unemployment and inequality without increase income. Expansion of industries, financial institutions, public utilities etc. is possible only with expansion of country's income.
Indian Economy
Salient Features of Indian Economy
The salient features of Indian Economy include the followings:
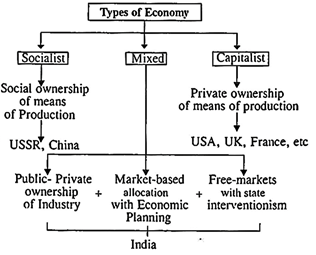
(1) Mixed Economy
India is a mixed economy. In a mixed economy, public sector (government-owned) business enterprises exist alongside the private sector to achieve a welfare state with socialistic pattern of society. Ever since independence, India's economic development has been guided by the twin objectives of developing:
(a) a rapidly and technologically progressive economy by democratic means; and
(b) a social order based on justice, offering equal opportunity to every citizen of the country.
(2) Low per Capita GDP
According to imp’s world Economic outlook India’s GDP per capita in 2016 was. $1719. India is 7th. Largest economy of the world. But due to its huge population of more than 1.26 billion, India is ranked 144th in terms of GDP per capita. Among Asian countries, India is ranked 34th. India’s per-capita GDP is only 16.66% of the world’s average per capita GDP. It is 61.56 times lower than the top ranked Luxembourg and 8.1 time greater than the lowest ranked South Sudan.
On the basis of PPP, India’s GDP per capita is$6162.
Average GDP per capita of world in terms of PPP is $16329. India is ranked 126th in GDP per capita in PPP terms.
2016
Per Capita Net National Income at current prices - Rs. 93,293
Per Capita Income at constant prices (2011-12 prices) - Rs. 77435
2015
GDP Per Capita at current prices- Rs. 98,983
GDP Per Capita at constant prices- (2011-12 prices) - Rs. 84,009.
(3) Dominance of Agriculture and Heavy Population Pressure on Agriculture
In India, almost 60-70% of the total population still resides in rural areas and hence they depend on agriculture for their livelihood.
(4) Over-Population
India is over populated. In every decade Indian population gets increased by about 20%. During 2001-11, population increased by 17.64%. With this high growth rate of population about 1.7 core new persons are added to Indian population every year. According to 2011 census, the total Indian population stands at a high level of 121.02 core which is 17.5% of the world's total population which is second largest population of the world. To maintain this 17.5% of world population India holds only 2.42% of total land area of the world.
(5) Unbalanced Economic Development
India has not yet achieved the goal of balanced economic development. According to latest data available about 53% of total labor force is dependent on agriculture, 19% on industries and the rest about 28% on trade, transport and other services.
(6) Low rate of capital formation
Another basic characteristic of the Indian economy is the existence of capital deficiency which is reflected in two ways - firstly, the amount of capital per head available is low; and secondly, the current rate of capital formation is also low.
Gross Fixed Capital Formation in India increased to 8797.63 INR billion in the fourth quarter of 2016 from 8601.50 INR billion in the third quarter of 2016.
Gross Fixed Capital Formation in India averaged 5019.53 INR billion from 2001 to 2016, reaching an all-time high of 9084.49 INR billion in the fourth quarter of 2015 and a record low of 2021.90 INR billion in the first quarter of 2002.
(7) Lack of Infrastructure Facility
There is a lack of physical infrastructure (i.e. road, electricity, banking, transportation, insurance, energy) and social infrastructure (i.e. education, health, housing, drinking water, sanitation) that hinders the development process of a country.
(8) Poor Economic Organisation
Another important feature of the Indian economy is poor economic organisation. Certain institutions necessary for economic development are not adequately developed. For instance, to mobilise savings and more especially the savings of the rural sector, the creation and development of financial institutions is essential. India suffers from inadequacy of financial institutions in rural areas. Similarly, India being a country of a large number of small farmers, me development of certain agencies of credit for granting loans to farmers on easy terms is needed. Likewise, to provide medium and long-term loans to industries for the development of industrial finance corporation is quite necessary. There is a great scarcity of skilled and efficient administrators and managers.
|
STATE OF THE INDIAN ECONOMY (Economic Survey 2016-17) |
||
|
1. |
GDP Growth |
2016-17:7.1% |
|
|
|
2017-18: 6.75-7.5% (Proposed) |
|
2. |
Inflation |
AtePI3.7% |
|
|
|
AtWPI3.4% |
|
3. |
Industrial Growth at Basic Prices |
Provisional 7.4% |
|
|
|
Advanced Est. 5.2% |
|
4. |
Services Growth at Basic Prices |
Provisional 8.9% |
|
|
|
Advanced Est. 8.8% |
|
5. |
Agriculture, Forestry & Fishing at Basic Prices |
Provisional 1.2% |
|
|
|
Advanced Est. 4.1% |
|
6. |
Fiscal Deficits of GDP |
2016-17: 3.5% |
|
|
|
2017-18 : 3.2% (Adv. Estimate) |
|
7. |
Trade Balance |
49.3% |
|
8. |
Foreign exchange Reserves to total Debt: |
76.8% |
|
9. |
External Debt (US$ billion) |
484.3 |
Structure Composition of Indian Economy
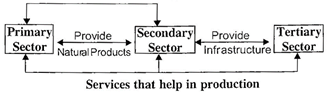
There are 3 major sectors of Indian economy- the primary sector, the secondary and the tertiary sector.
Manufactured goods used as Inputs
|
Sector |
Activity |
|
Primary Sector |
Agriculture and Allied Sector |
|
Forestry |
|
|
Fishing |
|
|
Mining &Quarrying |
|
|
Secondary Sector or Industrial sector |
Manufacturing |
|
Electricity, Gas and Water Supply |
|
|
Construction |
|
|
Tertiary Sector or Service Sector |
Trade, Hotels and Restaurants |
|
Transport |
|
|
Storage |
|
|
Communication |
|
|
Financing, (Banking Insurance) |
|
|
Real Estate and Business Services |
|
|
Community, Social, Personal and other Services |
The Central Statistics Office (CSO), Ministry of Statistics and Programme Implementation have released the advance estimates of GDP growth rates for 2016-17 and Q1,Q2,Q3 of 2016-17 at constant (2011-12) and current prices are gives below:
|
Growth Rates of GDP (Economic Survey (2016-17) |
||
|
|
Constant Prices (2011-12) |
Current Prices |
|
Annual 2016-17 (Advance) |
7.1% |
11.5% |
|
Q.I 2016-17 (April-June) |
7.2% |
10.8% |
|
Q.2 2016-17 (July-Sept) |
7.4% |
11.8% |
|
Q.3 2016-17 (Oct-Dec) |
7.0% |
10.6% |
National Income of India
National income measures the net value of goods and services produced in a country during a year and it also includes net earned foreign income. In other words, a total of national income measures the flow of goods and services in an economy. National income is a flow not a stock. As contrasted with national wealth which measures the stock of commodities held by the nationals of a country at a point of time, national income measures the productive power of an economy in a given period to turn out goods and services for final consumption.
Concepts of National Income
The various concepts of national income are as follows:
1. Per Capita Income
It is a measure of the amount of money that is being earned per person in a certain area.
\[PCI=\frac{National\,Income}{Population}\]
2. Gross National Product (GNP)
Gross National Product refers to the money value of total output or production of final goods and services produced by the nationals of a Country during a given period of time. Generally a year.
In the calculation of GNP, we include the money value of goods and services produced by nationals outside the country. Hence, income produced and received by nationals of a country within the boundaries of foreign countries should be added in Gross Domestic Product (GDP) or the country. Similarly, income received by foreign nationals within the boundary of the country should be excluded from GDP.
In equation form:
GNP = GDP + X - M
Where,
X = Income earned and received by nationals within the boundaries of foreign countries.
M = Income received by foreign nationals within the country.
If X = M, then GNP = GDP.
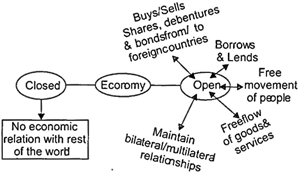
Similarly, in a closed economy
X = M = 0 then also GNP = GDP
In equation form:
GNP = GDP + NFIA
Where NFIA = Net Factor Income from abroad also NFIA = Factor incomes received from abroad - Factor income paid to abroad.
It is to be noted here that in a closed economy which does not deal with outside world, has no NFIA, i.e. its NFIA is equal to Zero. Hence, for such countries, GDP = GNP
Gross Domestic Product (GDP)
It is the total money value of all final goods and services produced within the geographical boundaries of the country during a given period of time. So, domestic product emphasis the total output which is raised within the geographical boundaries of the country, national product focuses not only on the domestic product but also on goods and services produced outside the boundaries of a nation.
3. Net National Product (NNP)
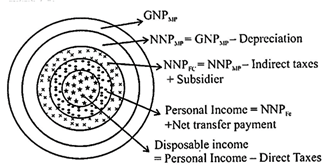
NNP is obtained by subtracting depreciation value (i.e. capital stock consumption) from GNP.
In equation form:
NNP = GNP - Depreciation.
4. National Income
GNP is based on market prices of produced goods which includes indirect taxes and subsidies. NNP can be calculated in two ways-
(i) at market prices of goods and services
(ii) at factor cost
When NNP is obtained at factor cost, it is known as National Income. National Income is calculated by subtracting net indirect taxes (i.e. total indirect tax- subsidy) from NNP at market prices. The obtained value is known as NNP at factor cost or National income. So, NNP at factor cost or National Income
= NNP at market price - (Indirect Taxes -Subsidy)
= NNP (mp) - Indirect Tax + Subsidy.
5. Personal Income
Personal income is that income which is actually obtained by nationals. Personal income is obtained by subtracting corporate taxes and payments made for social security's provision from national income and adding to it government transfer payments, business transfer payments and net interest paid by the government. So,
Personal Income = National income ? undistributed profits of corporation - payments for social security provisions - corporate tax + government transfer payments + Business transfer payments + Net interest paid by government.
It should always be kept in mind that personal income is a flow concept.
6. Disposable Personal Income
When personal direct taxes are subtracted from personal income, the obtained value is called disposable personal income (DPI).
So,
DPI = [Personal income] - [Direct Taxes]
A Graphical Representation of relationship between various measures.
Methods of Measuring National Income
National Income of a country is calculated by following three methods:
1. Product Method
In this method net value of final goods and services produced in a country during a year is obtained and the total obtained value is called total final product. This represents Gross Domestic Product (GDP). Net income earned in foreign boundaries by nationals is added and depreciation is subtracted from GDP.
2. Income Method
In this method, a total of net incomes earned by working people in different sectors and commercial enterprises is obtained.
Symbolically: National Income = Total Rent +
Total Wages + Total Interest + Total Profit.
3. Consumption Method
It is also called expenditure method. Income is either spent on consumption or saved. Hence national income is the addition of total consumption and total savings.
In India a combination of production method and income method is used for estimating national income.
Symbolically: N.I = C + I + G + (X - M)
Where,
C = Total consumption expenditure
I = Total Investment Expenditure
G = Total Govt. Expenditure.
X = Export
M = Import
Estimates of National Income in India
In 1868, the first attempt was made by Dadabhai
Naoroji. He, in his book 'Poverty and Un-British Rule in India', estimated Indian per capita annual income at a level of Rs.20.
Some other economists followed it and gave various estimates of India national income, some of these estimates are as follows:
Findlay Shirras (1911) - Rs.49
Wadia & Joshi (1913-14) - Rs.44.30
Dr. V.K.R.V. Rao (1925-29) - Rs.76
After independence, the Government of India appointed the National Income Committee in August 1949 under the chairmanship of Prof. P.C. Mahalanobis, to compile authoritative estimates of national income. For further estimation of national income, the government established Central Statistical Organisation (CSO) which now regularly publishes national income data.
CSO & NSSO to be Merged:
The government is planning to merge Central Statistical
Organisation (CSO) and National Sample Survey
Organisation (NSSO) for promoting statistical network in the country. The newly merged unit will be named as
National Statistical Organisation (NSO). The head of the organisation will be designated as 'Chief of Statistician of
India' and will be having the rank of Chief Secretary.
Indicators of Economic Development
The major indicators to increase the levels of development are:
(i) Net National Product (NNP)
It is defined as the total output produced by a country in one financial year. It can be computed by subtracting depreciation from GNP. NNP is also called as National Income.
(ii) Per Capita Income
A high per capital income indicates a better standard of living and thus, economic development on the whole.
Further, a rise in per capita income will always mean a rise in aggregate real output.
(iii) Quality of Life Index (QLI): The Index of Quality of life depends upon mainly three factors, i.e. life expected, Basic Literacy ad Infant
Mortality Rate. Most of the countries with low per capita GNP tends to have to QLI and vice-a-versa.
(iv) Human Development Index (HDI): It is one of the most recent and significant indicator of economic development of a country. It is a composite of three indicators, i.e.
Life Expectancy Index (LEI); Education Attainment Index (EAI) and Standard of Living Index. (HDI) ranks countries in relations to each other. It can be computed by using following formula:
\[HDI:\sqrt[3]{LEI\times EAI\times SLI}\]
Population
Theory of Demographic Transitions
Demography is the scientific study of human population.
The relationship between population growth and economic development can be explained by the Theory of Demographic Transition for contemporary developed nations. There are three stages of population growth.
(i) First stage of stable or slow population growth
Due to the high death rate which nullified the high birth rate.
In this stage, these economies were primitive and primarily agrarian, with widespread illiteracy, poor sanitation and health care conditions, negligible knowledge of family planning and large family sizes which contributed to factors such as high fertility rate and high death rate. In the period between the first and the second stages, the death rates start reducing and birth rates remain stable which brings an imbalance in the economy. Measures like diseases control, improving nutrition levels, and sanitation improvement are implemented to reduce death rates, but the measures for controlling birth rates are not implemented, which results in population explosion.
This required a period of transition for adjustment, thus bringing the second stage of transition.
(ii) Second stage of population explosions
In this stage rise in income levels contributed to improvement in health-care, education, disease control and so on which in turn contributed to reducing the death rates. This accelerated the growth population. The family size reduced and improved trade and economic conditions resulted in more food and better food habits which further helped the population to grow at a much higher rate than in the first stage. The demographic changes brought imbalances in the economy, creating conditions for further transition of society.
(iii) Third stage of low birth rates and low death rates
Modernization and industrialization changed the living pattern in such nations, the rural population shifted to cities and family sizes reduced to become nuclear families. The standard of living increased which further brought down mortality rates and birth rates. As a result, the growth of population declined.
Population and development in Indian perspective
India's population grew slowly till the 1920s. The year 1921 is known as the year of the Great Divide, since there was an actual decline in population in that Census, brought about by an influenza epidemic. The most spectacular growth in population was witnessed after Independence, as is clear from the table below.
Population Growth
|
Year |
Population (in millions) |
Growth rate during decade (%) |
Average annual growth rate (%) |
|
1921 |
251.3 |
-0.31 |
-0.03 |
|
1931 |
278.9 |
11 |
1.04 |
|
1941 |
318.6 |
14.22 |
1.33 |
|
1951 |
361 |
13.31 |
1.25 |
|
1961 |
439.2 |
21.51 |
1.96 |
|
1971 |
548.1 |
24.8 |
2.2 |
|
1981 |
683.3 |
24.66 |
2.22 |
|
1991 |
846.3 |
23.85 |
2.14 |
|
2001 |
1027 |
21.34 |
1.9 |
|
2011 |
1.21 |
17.64 |
1.41 |
Due to the high rate population growth, it has not been possible to make a significant change in the poverty levels in India. The higher population growth, the lower is the rate of growth of per capita income. The rapid growth in population, which is one of the highest in the world and making up one-fifth of the total world population, is eroding India's considerable development gains and steadily diminishing its ability to provide a decent quality of life for a large number of its people. However, several economists and demographers are of the opinion that India's growing population is not hindering rapid development. According to them a rise in income will automatically bring down the rate of population growth as in developed nations. However, rapid population growth is a development problem. Continuing rapid population growth in the long run is likely to mean a lower quality of life for millions of people. In die developing countries die main economic class that suffers are the poor. It is also the poor, with little education, low and insecure income, poor, health and large families, who lose out as rapid population growth hampers development. This points to the need for a comprehensive public policy aimed at reducing population growth.
|
|
India : Demographics (2013 Estimates) |
|
|
1. |
Population growth rate |
1.19% (2016) |
|
2. |
Birth rate |
19.3 (Per 1000) (2016) |
|
3. |
Death Rate |
7.3 (Per 1000) (2016) |
|
4. |
Infant Mortality Rate |
40 (Per 1000 live birth) (2013) |
|
5. |
Female Infant Mortality Rate |
39 (per 1000) (2013) |
|
6. |
Female Infant Mortality Rate |
42 (per 1000) (2013) |
|
7. |
Total fertility rate |
2.3 (SRS 2013) |
|
Birth Rate and Death Rate in India (Per thousand Population) |
||
|
Year |
Birth Rate |
Death Rate |
|
1950-51 |
39.9 |
27.4 |
|
1960-61 |
41.7 |
22.8 |
|
1970-71 |
36.9 |
14.9 |
|
1980-81 |
33.9 |
12.5 |
|
1990-91 |
29.5 |
9.8 |
|
2000-01 |
25.4 |
8.4 |
|
2007-08 |
23.5 |
7.4 |
|
2008-09 |
22.8 |
7.4 |
|
2009-10 |
22.5 |
7.3 |
|
2010-11 |
22.1 |
7.2 |
India is the first country in the world which has officially sponsored family planning programmes to control population in order to accelerate the overall development of the country.
The programme was officially launched in 1952. The first two family planning clinics were opened in Karnataka in 1930 which were supposed to be the first such in the world.
National Commission on Population
The National Commission on Population was constituted on May 11,2000 under the Chairmanship of the Prime Minister to provide overall guidance for population stabilisation by promoting synergy between demographic, educational, environmental and development programmes.
On May 19, 2005 the National Commission on Population was reconstituted. This Commission has now been transferred from Planning Commission to Ministry of Health. It is chaired by the Prime Minister. Earlier Deputy Chairman of the Planning Commission acted as the Vice-Chairman of NCP. Now Planning Commission has been abolished and replaced by NITI Aayog. Chief Ministers of all states, ministers of the related central ministries, secretaries of the concerned departments, eminent physicians, demographers and the representatives of the civil society are members of NCP.
The National Commission on Population has undertaken various initiatives for implementing the National Population Policy such as review of the implementation of National Family Welfare Programme especially in the high fertility States, identification of high fertility districts and preparation of District Action Plans, selection of Social Economic and Demographic Indicators for monitoring purpose, promotion of policy-oriented relevant research for population stabilisation and promotion of public private partnership in meeting the unmet needs of family planning services.
National Population Policy 2000
The problem of overpopulation can be solved by two ways
Initially, it was a purely birth control programme.
It became evident during the course of time that such a narrow approach will not pay. False reporting of the achievements of targets by the executing agency and wasteful expenditure were some of the serious drawbacks of the target approach.
The Government in February 2000, announced the National Population Policy (NPP) with the following objectives:
(i) The immediate objective is to address the unmet needs for contraception, health care infrastructure and basic reproductive and child health care.
(ii) The medium-term objective is to bring the Total Fertility Rate (TFR) to replacement levels of 2.1 by 2010.
(iii) The long-term objective is to achieve a stable population by 2045, at a level consistent with the requirement of sustainable economic growth, social development and environmental protection.
A National Commission on Population, with the Prime Minister as the President and State Chief Ministers, Union Ministers, NGOs, demographers and public health professionals as members has been set up. This Commission of more than 100 members will oversee and review the implementation of the policy.
The policy emphasises the pivotal role of urban and rural local bodies in implementing it. Promotional and motivational measures in the policy include rewarding the local bodies for exemplary performance, cash incentives to mothers and couples who undergo sterilisation, etc.
The NPP has accepted the recommendation of the Swaminathan Committee regarding extension of the freezing of seats in legislatures and Parliament on the basis of 1971 Census. The Parliament has passed the necessary legislation approving the freezing of seats up to 2026, instead of 2011 as suggested by the Committee.
The present approach National Commission on Population is based on evolving appropriate strategies to improve the performance of demographically weak states, drawing lessons from the southern states. The weaker states are: Bihar, Jharkhand, Madhya Pradesh, Chhattisgarh, Rajasthan, Uttar Pradesh and Odisha.
12 Indian states out of the reporting 23 states have reached levels of fertility that are below the replacement rate (2.1).
Even high TFR states like Bihar, U.P, M.P, and Rajasthan are posting stronger fertility declines.
Human Development Index (HDI)
HDI is a broad-based index that assesses the development of an economy, on the basis of the performance of the economy in various indicators. The need to create such an index was felt as the concept of GDP and per capita income could not demonstrate the various aspects of human development. The concept of HDI was evolved by economist Mahbub-ul-Haq.
The HDI calculates the development of an economy in terms of three major indicators.
Indicators of HDI
The HDI is an equi-weighted average of-
The weight assigned to Adult Literacy Rate (ALR) is \[\frac{2}{3}\] while that for Combined Enrolment Ratio (CER) is \[\frac{1}{3}\]
Therefore,
Educational Attainment Index may be given as-
EM=\[\frac{2}{3}\]ALR+\[\frac{1}{3}\]-CER
HDI has categorised countries into
- very high human development (USA, UK, etc.)
- high human development
(Sri lanka, China and India)
- low human development
(Pakistan, Bangladesh and Nepal)
|
Meaning of HDI Value |
|
|
Different levels of development in terms of HDI score |
|
|
0.791 and above |
|
0.699 to 0.790 |
|
0.541 to 0.698 |
|
0.337 to 0.540 |
Human Development Report 2016
Human Development Report is an annual report published by the United Nations Development Programme (UNDP). The title of 2016 edition of the HDR is ?Human Development for Everyone.? The top three countries in terms of Human Development Index are Norway. Australia and Switzerland In 2016 India has been placed at position with a score of 0.624 131 out of 188 countries.
It has been put under the medium human development category.
Gender Inequallity Index 2016
It is an index for measurement of geneder disparity. It was introduced in 2010
Human Development Report.
India's Rank - 125 (out of 159 countries) Global Hunger Index - 2016
GHI is a multidimensional tool used to describe the state of countries hunger situation. It is released by International Food Policy Research Institute (IFPRI) every year since 2006.
India's Rank - 97 (Out of 118 Developing Countries)
India's Rank in Important International Reports/Index
|
Index / Report |
India's Rank |
|
Gender Inequality index 2015 |
\[{{130}^{th}}\](Out of 155 countries) |
|
Global Hunger Index 2016 |
28.5 (Serious hunger situation) |
|
Global Competitiveness Report 2015-16 |
(Out of 140 economies) |
|
World Investment Report 2016 |
10th (in FDI inflows in the world) |
|
Global Gender Gap 2015 |
108th (Out of 145 economies) |
|
Ease of Doing Business Index 2017 |
130th (Out of 190 economies) |
|
Global Innovation Index 2016 |
66th (Out of 128 countries) |
|
Global Human Capital Index 2016 |
105th (Out of 130 countries) |
Occupational Distribution of Population
Occupational structure refers to distribution of work force in the different occupations of the country. As economy grows, labuor force shifts from primary sector to secondary and tertiary sector.
|
Occupation |
1951 |
1971 |
1991 |
2001 |
|
Primary sector |
72.1 |
72.1 |
62.7 |
89.3 |
|
Secondary sector |
10,6 |
11.2 |
14.9 |
18.2 |
|
Tertiary sector |
17.3 |
16.7 |
22.14 |
22.5 |
|
Total |
100 |
100 |
100 |
100 |
Growth of Population and workforce-All India Category
|
Category |
Person |
Male |
Female |
||||||
|
|
1981-91 |
1991-01 |
2001-11 |
1981-91 |
1991-01 |
2001-11 |
1981-91 |
1991-01 |
2001-11 |
|
Total Population |
2.1 |
2.0 |
1.6 |
2.2 |
1.9 |
1.6 |
2.1 |
2.0 |
1.7 |
|
Total Workers |
2.5 |
2.5 |
1.8 |
2.2 |
2.1 |
1.9 |
3.5 |
3.5 |
1.7 |
|
Main workers |
2.5 |
0.9 |
1.5 |
2.2 |
0.8 |
1.3 |
3.6 |
1.2 |
2.1 |
|
Marginal workers |
2.5 |
12.3 |
2.8 |
2.6 |
29.5 |
5.1 |
3,2 |
7.9 |
1.1 |
Sex Ratio in population and Workforce-All India
|
Year |
Population |
Total Workers |
Main Workers |
Marginal Workers |
|
1981 |
933 |
351 |
253 |
5245 |
|
1991 |
927 |
400 |
290 |
9425 |
|
2001 |
933 |
461 |
303 |
1520 |
|
2011 |
940 |
452 |
327 |
1032 |
Note: 1. Rural and urban combined.
Source: Census of India.
Work Participation Rate:
Percentage of workers (main+marginal) to total population.
Main Workers:
A person who has worked for major part of the reference period (i.e.6 months or more during the last one year preceding the date of enumeration) in any economically productive activity is termed as 'main Worker.?
Marginal Workers:
A person who has worked for 3 months or less but for less than 6 months of the reference period in any economic activity is termed as marginal worker.


You need to login to perform this action.
You will be redirected in
3 sec

