Introduction to Graphs
Category : 8th Class
Introduction to Graphs
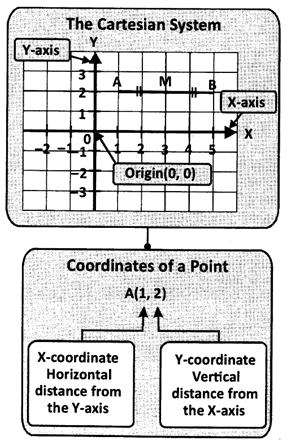
(i)A plane is divided into 4 quarters (called quadrants) by two perpendicular lines, intersecting at 0 (called origin). The horizontal line is called the X-axis and the vertical line is called the Y-axis.
(ii) A point is represented by the horizontal distance from the origin called the x-coordinate and by the vertical distance from the origin called the y-coordinate.
(ii) A point is represented by an ordered pair (x, y) where x is the x-coordinate and y is the y-coordinate.
|
Representation of data |
Advantages |
Disadvantages |
|
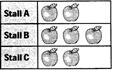
Pictogram Sales of Fruits
Key:1 Represents 50 Apples |
Data is represented in an attractive manner. |
Not accurate Difficult and time consuming to draw data involving fractions. |
|
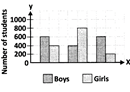
Bar Chart Number of students enrolled in three years
|
Easy to construct Shows the exact quantities of each data category. |
Does not how comparisons between the categories of data. the categories of data.
|
|
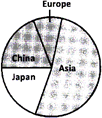
Pie chat
|
Shows Clearly the Difference in magnitude between the categories. |
Long calculations are needed. Not suitable if too many categories of Data are involved. Actual quantities are not displayed.
|


You need to login to perform this action.
You will be redirected in
3 sec