Data Handling
Category : 3rd Class
Data Handling
Learning Objective
Introduction
Everyday we come across a lot of information in the form of numerical figures, tables and graphs. These are provided by newspapers, televisions, magazines and other means of communication. The term "data handling' is all about gathering information and representing the same through pictographs and diagrams. In this chapter, we will study about pictograph and bar graph, and how to extract information’s contained by the graphs.
Data
A collection of facts, such as numbers, words, measurements, observations or even just descriptions of things is called data. Data can be represented graphically to give clear idea of what it represents. It is easier to interpret and organise data using pictorial representation some of the way data can be represented pictorially are:
(1) Pictograph (2) Bar graph
Pictograph
A picture used to represent an item of data is called a symbol. A pictograph is way of showing data using pictures. In a pictograph, lots of simple pictures as symbols are used to given information, where a key is provided to tell what quantity is represented by each symbol. Generally pictographs are used to represent less information. In a pictograph, we will need to look at the key carefully to determine how many items or quantities are represented by each symbol.
Suppose the following data were collected about favorite colours of students of a class.
|
Red |
|
|
Blue |
|
|
Green |
|
|
Yellow |
|
|
White |
|
|
Purple |
|
|
Key |
|
Clearly, here one symbol ![]() represents 3 students. If we observe the given pictograph, we conclude that the largest number of students
represents 3 students. If we observe the given pictograph, we conclude that the largest number of students
like red colour and the least number of students like blue colour.
Bar Graph
We can also represent data pictorially with the help of a bar graph. A bar graph is a chart that uses bars to show comparisons between categories of data. It is an another types of graph used to show data or information in a quick way. The bars can be either horizontal or vertical. Bar graphs with vertical box are sometimes called vertical bar graphs. They are quite simple and easy to draw.
To draw a bar graph, we need two axes: horizontal axis is called the X-axis and the vertical axis is called the Y-axis. Let us draw a bar graph.
Suppose the following data were collected regarding the number of students in class 1 to 6 of a school.
|
Class-1 |
Class-2 |
Class-3 |
Class-4 |
Class-5 |
Class-6 |
|
20 |
25 |
15 |
30 |
25 |
10 |
Let us draw a bar graph to detect this information.
Step 1: Draw a horizontal line OX and a vertical line OY, meeting at a point 0.
Step 2: Choose a convenient scale. Along OX and OY, mark point at equal intervals.
Step 3: Now, from the points taken along OX, draw rectangular bars keeping width of the bars and distance between the bars equal. Length (heights) of the bars represent respective observations.
Step 4: Label these rectangular bars with the company they represent and shade the bars. ;
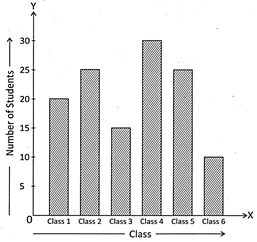
Here, X-axis represents the classes (1 to 6) and Y-axis represents the number of students in each class. Clearly, in the given figure shown above, 5 units on Y-axis represents 5 students, 10 units represents 10 students, and so on. Therefore, we obtained the bar graph to depict the given information.
Example-1
Direction (Q. No. 1 to 5):
In a school canteen, the number of ice-creams sold in the first six month was represented in the pictograph given below.
|
January |
|
|
February |
|
|
March |
|
|
April |
|
|
May |
|
|
June |
|
|
One |
|
Read the pictograph and answer the following questions:
1. The key signifies that one ![]() represents:
represents:
(a) 100 ice-creams (b) 120 ice-creams
(c) 150 ice-creams (d) 50 ice-creams
(e) None of these
Answer (c) is correct.
Explanation: The key signifies that one ![]() represents 150 ice-creams.
represents 150 ice-creams.
Rest of the options is incorrect because of the correctness of option (c).
2. In which month, the maximum number of ice-creams were sold?
(a) January (b) April
(c) May (d) June
(e) None of these
Answer (d) is correct.
Explanation: The maximum number of symbols are shown in the month of
June that is 8 symbols. Therefore, in the month of June, the maximum number of ice-creams were sold.
Rest of the options is incorrect because of the correctness of option (d).
3. In which month the least number of ice-creams were sold?
(a) January (b) February
(c) March (d) May
(e) None of these
Answer (b) is correct.
Explanation: The least number of symbols are shown in the month of February that is 2 symbols. Therefore, the least number of ice-creams were sold in February.
Rest of the options is incorrect because of the correctness of option (b).
4. In which two months the same number of ice-creams were sold?
(a) March and May
(b) May and June
(c) January and February
(d) April and March
(e) None of these
Answer (a) is correct.
Explanation: Equal number of symbols are shown in the months of March and May that is 5 symbols. Therefore, the same number of ice-creams were sold in March and May.
Rest of the options is incorrect because of the correctness of option (a).
5. How many ice-creams were sold in all six months?
(a) 4000 (b) 5500
(c) 4500 (d) 3500
(e) None of these
Answer (c) is correct.
Explanation: Total number of symbols from January to June \[=\left( 3+2+5+7+5+8 \right)=30.\]
One symbol = 150 ice-creams.
Number of ice-creams sold in all six months \[=30\times 150=4500\]
Therefore, 4500 ice-creams were sold in all six months.
Rest of the options is incorrect because of the correctness of option (c).
Common Asked Question
1. Some notebooks are equally distributed among 5 students in a week as given below. If one symbol represents 2 notebooks, how many notebooks did each student get?
|
Monday |
|
|
Tuesday |
|
|
Wednesday |
|
|
Thursday |
|
|
Friday |
|
|
Saturday |
|
(a) 4 (b) 5
(c) 6 (d) 8
(e) None of these
Answer (a) is correct.
Explanation:
Total number of symbols \[=2+1+2+1+1+3=10\]
Total number of notebooks \[=\text{2}\times 10=20\]
Therefore, each student got \[\frac{20}{5}\] notebooks = 4 notebooks
Rest of the options is incorrect because of the correctness of option (a).
2. The trees in a certain area of a forest were represented in a pictograph as given below:
|
Area |
Tree |
|
A |
|
|
B |
|
|
C |
|
|
D |
|
If one symbol ![]() represents 5,000 trees, then the sum of numbers of trees in both areas B and D will be:
represents 5,000 trees, then the sum of numbers of trees in both areas B and D will be:
(a) 30,000 (b) 20,000
(c) 40,000 (d) 25,000
(e) All of these
Answer (a) is correct.
Explanation: Number of symbols in area B = 2
Number of tree in area B \[=2\times 5,000=10,000\]
Number of symbols in area D = 4
Number of trees in area D \[=4\times 5,000=20,000\]
Therefore, the sum of numbers of trees in both areas B and D
= 10,000 + 20,000 = 30,000
Rest of the options is incorrect because of the correctness of option (a).
Direction (Q. No- 3 to 7): The picture given in table shows the number of toys that were sold in a day of a particular week at a toy shop.
|
Monday |
|
|
Tuesday |
|
|
Wednesday |
|
|
Thursday |
|
|
Friday |
|
|
Saturday |
|
|
One |
|
Study the pictograph carefully and answer the following questions:
3. Which day has the least sale of toys at the shop?
(a) Tuesday (b) Wednesday
(c) Friday (d) Saturday
(e) None of these
Answer (b) is correct.
Explanation: Number of symbols shown on Wednesday is 2 that is the least number of symbols among all. Therefore, Wednesday has the least sale of toys at the shop.
Rest of the options is incorrect because of the correctness of option (b).
4. Which day has the highest sale of toys at the shop?
(a) Monday (b) Tuesday
(c) Thursday (d) Friday
(e) None of these
Answer (c) is correct.
Explanation: Number of symbols shown on Thursday is 6 that is the highest number of symbols among all. Therefore, Thursday has the highest sale of toys at the shop.
Rest of the options is incorrect because of the correctness of option (c).
5. Which two days have same sale?
(a) Tuesday and Wednesday
(b) Wednesday and Thursday
(c) Thursday and Tuesday
(d) Monday and Friday
(e) None of these
Answer (d) is correct.
Explanation: Number of symbols shown on Monday and Friday is same that is equal number of symbols 5. Therefore, Monday and Friday have the same sale of toys.
Rest of the options is incorrect because of the correctness of option (d).
6. Which day has sale of exact 60 toys?
(a) Monday (b) Tuesday
(c) Wednesday (d) Thursday
(e) None of these
Answer (b) is correct.
Explanation: Here, 1 symbol represents 20 toys.
Therefore, number of symbols for 20 toys \[=60\div 20=3\]
Now, seeing the pictograph, Tuesday has 3 symbols.
So we have, Tuesday has sale of 60 toys.
Rest of the options is incorrect because of the correctness of option (b).
7. What was the total sale of toys in the week?
(a) 440 (b) 380
(c) 480 (d) 500
(e) None of these
Answer (d) is correct.
Explanation: Here, total number of symbols \[=5+3+2+6+5+4=\text{ }25\]
One symbol represents 20 toys.
Hence, the total sale of toys in the week \[=25\times 20=500\]
Rest of the options is incorrect because of the correctness of option (d).


You need to login to perform this action.
You will be redirected in
3 sec