| Days | Sunday | Monday | Tuesday | Wednesday | Thursday | Friday |
| Number of books sold | 65 | 40 | 30 | 50 | 20 | 70 |
Answer:
To draw a bar graph, we will use the following steps. (i) Firstly, draw two perpendicular lines, one is horizontal and one is vertical. Along the horizontal line, mark 'days' and along the vertical line mark 'number of books sold'. (ii) Now, take scale of 1 unit length = 5 books, along the vertical line and then mark the corresponding values. Also, the heights of the bars for various days are as follows:
(iii) Draw bars of equal width and of height calculated in Step (ii) on the horizontal line with equal spacing (or gap) between them. Thus, we get the following bar graph. Sunday \[\frac{65}{5}=13\text{units}\] Monday \[\frac{40}{5}=8\text{units}\] Tuesday \[\frac{30}{5}=6\text{units}\] Wednesday \[\frac{50}{5}=10\text{units}\] Thursday \[\frac{20}{5}=4\text{units}\] Friday \[\frac{70}{5}=14\text{units}\] 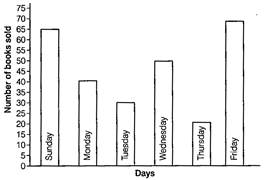


You need to login to perform this action.
You will be redirected in
3 sec

