| Preferred activity | Number of students |
| Plying | 45 |
| Reading story books | 30 |
| Watching TV | 20 |
| Listening to music | 10 |
| Painting | 15 |
Answer:
To draw a bar graph of given data, we use the following steps. (i) Firstly, draw two perpendicular lines, one is horizontal and one is vertical. Along the horizontal line, mark the preferred activity and along the vertical line, mark the corresponding number of students. (ii) Now, take scale of 1 unit length = 5 students along the vertical line and then mark the corresponding values. Also, the height of the bars for various activities are as follows:
(iii) Draw bar of equal width and of height calculated in Step (ii) on horizontal line with equal spacing between them. Thus, we get the following bar graph Plying \[\frac{45}{5}=9\text{units}\] Reading story books \[\frac{30}{5}=6\text{units}\] Watching TV \[\frac{20}{5}=4\text{units}\] Listening to music \[\frac{10}{5}=2\text{units}\] Painting \[\frac{15}{5}=3\text{units}\] 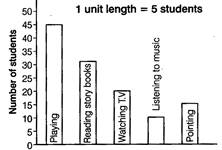 From the above bar graph, it is clear that the activity 'reading story books' is preferred by most of the students other than playing. Because the second larger bar is for reading story books.


You need to login to perform this action.
You will be redirected in
3 sec

