A)
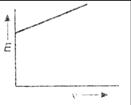
B)
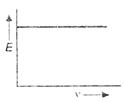
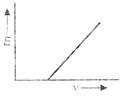
C)
D)
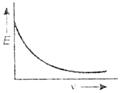
Correct Answer: C
Solution :
Key Idea: Photoelectric equation has same form as equation of straight line. If using light of different frequencies a graph is plotted between the maximum kinetic energy \[{{E}_{k}}\] of the photoelectrons and frequency (v) of light, then a straight line is obtained, according to relation \[{{E}_{k}}=h{{v}_{0}}-W,\] where W is the intercept cut by straight line on negative \[{{E}_{k}}-\]axis.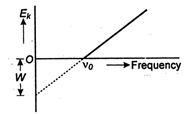 Note: If the straight line is extended backwords, it intersects the frequency axis at a point \[{{v}_{0}}\] and intercepts the energy axis at - w. This means that for the photoelectrons to be emitted from a given metal plate the frequency of incident light should be higher than \[{{v}_{0}},\]otherwise no photoelectrons are emitted.


You need to login to perform this action.
You will be redirected in
3 sec

