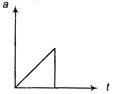
 The most probable velocity-time graph of the body is
A)

B)

C)

D)

Correct Answer: C
Solution :
From given a-t graph acceleration is increasing at constant rate \[{{\text{H}}^{\text{+}}}\](constant) \[\text{(initial 200}\times \text{0}\text{.031}\times \text{2=12}\text{.4}\] (by integration) \[\text{O}{{\text{H}}^{\text{-}}}\]\[\left( \text{initial} \right)\text{=84 }\!\!\times\!\!\text{ 0}\text{.15=12}\text{.6}\] \[\text{O}{{\text{H}}^{\text{-}}}\]\[{{\text{ }\!\![\!\!\text{ O}{{\text{H}}^{\text{-}}}]}_{\text{final}}}=\frac{0.2}{284}=7\times {{10}^{-4}}\text{M}\] i.e., v is dependent on time parabolic ally and parabola is symmetric about v-axis and suddenly, acceleration becomes zero. i.e., velocity becomes constant. Hence the most stable graph is (c).


You need to login to perform this action.
You will be redirected in
3 sec

