A)
B)

C)

D)
Correct Answer: A
Solution :
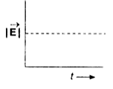
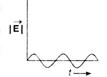
When two plane-polarised waves are superimposed, then under certain conditions, the resultant light vector rotates with a constant magnitude in a plane perpendicular to the direction of propagation. The tip of the vector traces a circle and the light is said to be circularly polarised. To form circularly polarised light \[{{E}_{x}}={{E}_{0}}\sin \omega t\] \[{{E}_{y}}={{E}_{0}}\cos \omega t={{E}_{0}}\sin \left( \omega t+\frac{\pi }{2} \right)\] where \[{{E}_{0}}\,\] is amplitude. Resultant amplitude \[|\overrightarrow{E}{{|}^{2}}={{E}_{0}}+{{E}_{0}}+2{{E}_{0}}.{{E}_{0}}\cos \frac{\pi }{2}\] \[|\overrightarrow{E}~{{|}^{2}}={{E}_{0}}\sqrt{2}=constant\] Hence, the correct graph will be (a).


You need to login to perform this action.
You will be redirected in
3 sec

