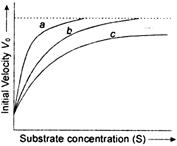
A) a-normal enzyme reaction, b-competitive inhibition, c-non-competitive inhibition
B) a-enzyme with an allosteric modulator added, b-normal enzyme activity, c-competitive inhibition
C) a-enzyme with an allosteric stimulator, b-competitive inhibitor added, c-normal enzyme reaction
D) a-normal enzyme reaction, b-non-competitive inhibitor added, c-allosteric inhibitor added
Correct Answer: A
Solution :
Enzymes are proteinaceous catalysts that accelerate a chemical reaction. In the given figure, curve a shows normal enzyme reaction while curve b shows a competitive inhibition reaction in which competitive inhibitors that resemble the substrate molecules, bind to the active site of the enzyme and thus slow down the reaction process whereas curve c show noncompetitive inhibition reaction in which the inhibitor binds to a part of the enzyme or enzyme substrate complex, other than the active site, known as the allosteric site. This deforms the active site of enzyme. Thus, the enzyme cannot catalyze the reaction.


You need to login to perform this action.
You will be redirected in
3 sec

