| Direction: Study the following graph carefully to answer the questions that follow: |
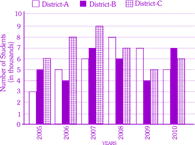
| Number of students (in thousands) enrolled in three different districts in six different years |
 |
A) 2006
B) 2007
C) 2008
D) 2009
Correct Answer: C
Solution :
(c) Total number of students ; Year 2005\[\Rightarrow \]14 thousand Year 2006\[\Rightarrow \]17 thousand Year 2007\[\Rightarrow \]22 thousand Year 2008\[\Rightarrow \]21 thousand Year 2009\[\Rightarrow \]16 thousand Year 2010\[\Rightarrow \]18 thousand


You need to login to perform this action.
You will be redirected in
3 sec

