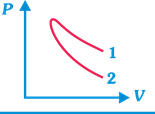
| P-V plots for two gases during adiabatic process are shown in figure. Plots 1 and 2 should correspond, respectively, to |
 |
A) He and \[{{O}_{2}}\]
B) \[{{O}_{2}}\] and He
C) He and Ar
D) \[{{O}_{2}}\] and \[{{N}_{2}}\]
Correct Answer: B
Solution :
[b] Slope of adiabatic curve \[\propto \gamma \]\[\propto \frac{1}{\text{Atomicity}\,\text{of}\,\text{the}\,\text{gas}}\]. So, \[\gamma \] is inversely proportional to atomicity of the gas. [as \[\gamma =1.66\] for monoatomic gas, \[\gamma =1.4\] for diatomic gas, and \[\gamma =1.33\] for triatomic non-linear gas.] From the graph it is clear that slope of curve 1 is less, so this should be adiabatic curve for diatomic gas (i.e., \[{{O}_{2}}\]). Similarly, slope of curve 2 is more, so it should be adiabatic curve for monoatomic gas (i.e. He).


You need to login to perform this action.
You will be redirected in
3 sec

