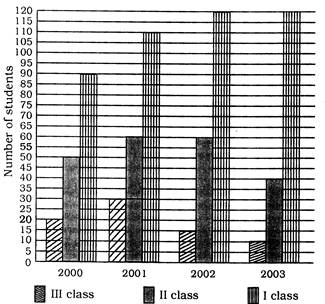
| Direction: The graph shows the result of 10th class students of a school for 4 years. Study the graph and answer the questions: |
 |
A) 2001
B) 2002
C) 2003
D) 2000
Correct Answer: A
Solution :
Number of students : Year 2000 \[\Rightarrow 20+50+90=160\] Year 2001 \[\Rightarrow 30+60+110=200\] Year 2002\[\Rightarrow 195\] Year 2003 \[\Rightarrow 170\]


You need to login to perform this action.
You will be redirected in
3 sec

