Directions (73-75): Study the following pie chart carefully and answer the questions given below. Percentage of number of different types of employees in a company in two consecutive years 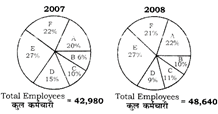 |
A) B
B) D
C) C
D) A
Correct Answer: A
Solution :
Change in A type of employees = 22% of 48,640 - 20% 42,980 = 10700 - 8596 \[\Rightarrow \]2104 Change in B type 10% of 48,640 - 6% of 42,980 = 4864 - 2578 \[\Rightarrow \] 2286 Change in C type = 11% of 48,640 - 10% of 42,980 = 5350 - 4298 \[\Rightarrow \] 1052 Change in D type = 9% of 48,640 - 15% of 42,980 = 4377 - 6447 \[\Rightarrow \] 2070 Clearly maxim am change is in B type


You need to login to perform this action.
You will be redirected in
3 sec

