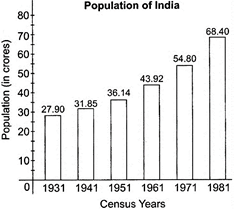
| Direction: The bar graph given here shows the population (in crores) of India in various census years. Observe the graph and answer the questions based on its |
 |
A) 1961
B) 1951
C) 1971
D) 1941
Correct Answer: B
Solution :
Percentage increase in 1941 \[=\left( \frac{31.85\times 27.90}{27.90} \right)\times 100\] \[=\frac{3.95\times 100}{27.90}=14.16%\] Percentage increase in 1951 \[=\left( \frac{36.14\times 31.85}{31.85} \right)\times 100\] \[=\frac{4.29\times 100}{31.85}=13.47%\]


You need to login to perform this action.
You will be redirected in
3 sec

