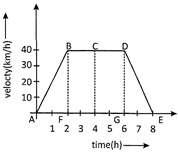
 Using this graph, calculate the average speed of the car.
A) \[40\,km/h\]
B) \[30\text{ }km/h\]
C) \[64\text{ }km/h\]
D) \[80\text{ }km/h\]
E) None of these
Correct Answer: B


You need to login to perform this action.
You will be redirected in
3 sec

