| Direction: Study the given bar graph and pie chart to answer the following questions. |
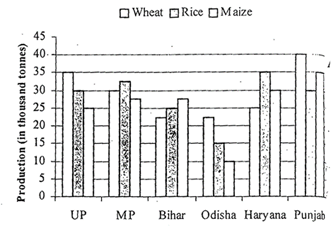
| The bar graph shows the production (in thousand tonnes) of Wheat, Rice and Maize in different states. |
|
| State |
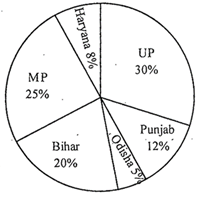
| The pie-chart shows the percentage of agriculture land in the given six states- \[\text{Productivity=}\frac{\text{Total}\,\text{production}}{\text{Area}\,\text{of}\,\text{agricultural}\,\text{land}}\] |
|
| Total agricultural land = 2 lakh square km |
A) Bihar
B) MP
C) Haryana
D) UP
E) Punjab
Correct Answer: E
Solution :
Production of Punjab is maximum =105000 tonnes


You need to login to perform this action.
You will be redirected in
3 sec

