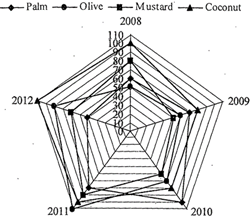
| Direction: Study the radar graph carefully and answer the questions that follow: |
| The graph show price (in per kg) of various types of oils in different years |
 |
A) 27.54% loss
B) 32.42% loss
C) 30.76% profit
D) 29.48% profit
E) 18% profit
Correct Answer: D
Solution :
Total cost price of oils \[=10\times 70+20\times 60+25\times 80=\]Rs. 3900 Total selling price \[=10\times 90+20\times 70+25\times 110=\]Rs. 5050 \[\therefore \]\[\text{Profit}=\frac{\text{Selling price}-\text{cost price}}{\text{Cost price}}\times 100\] \[=\frac{1150}{3900}\times 100=29.48%\]


You need to login to perform this action.
You will be redirected in
3 sec

