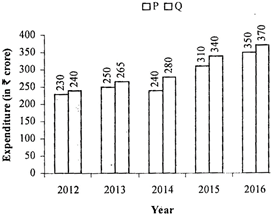
| Direction: Study the following bar graph and line graph carefully and answer the questions given below: The following bar graph shows the expenditure (in Rs. cr) of company P and Q. \[\text{ }\!\!%\!\!\text{ profit=}\frac{\text{income-Expenditure}}{\text{Expenditure}}\text{ }\!\!\times\!\!\text{ 100}\] |
 |
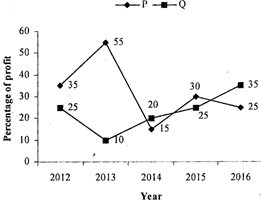
| The line-graph shows the percentage profit of two companies over the years. |
 |
A) 152.06%
B) 150.08%
C) 147.05%
D) 145.91%
E) 137.51%
Correct Answer: B
Solution :
Income of Company P in 2016 \[=350\times \frac{125}{100}=350\times 1.25=Rs.437.5\,\,cr\] Income of Company Q in 2013\[=265\times \frac{110}{100}\] \[=265\times 1.10=Rs.291.5\,\,cr\] \[\therefore \]Reqd\[%=437.5\times \frac{100}{291.5}=150.08%\]


You need to login to perform this action.
You will be redirected in
3 sec

