| Directions: Study the following graph carefully and answer the questions that follows. [SBI (Clerk) 2009] |
| Population of two States A and B over the years |
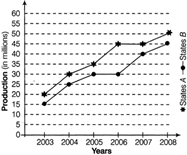 |
| For State B, the percentage rise in population from the previous year was the highest in which of the following years? |
A) 2008
B) 2006
C) 2005
D) 2004
E) 2007
Correct Answer: D
Solution :
| When we see the graph carefully we observe that the slope or change is highest for year 2004 and 2007. So, |
| In the year\[2004\,=\,\frac{25-15}{15}\,\times \,100\]% = 66.66% |
| In the year \[2007=\frac{45-30}{30}\times 100%=50%\] |
| Hence, the percentage rise is highest in the year 2004. |


You need to login to perform this action.
You will be redirected in
3 sec

