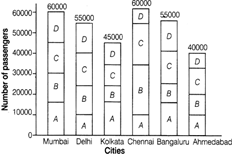
| Directions: The following bar diagram shows the number of passengers carried to different cities in first quarter of a year by four airlines, A, B, C and D has been given. Study the following diagram carefully and answer the questions. [Corporation Bank (SO) 2014] |
 |
| The number of passengers travelling to Chennai by airline A in second quarter is 150% of that in first quarter by the same airline. The number of passengers in the second quarter by the same airline is 120% of that in the third quarter. What is the percentage increase in the number of passengers in third quarter from that in first quarter? |
A) 15%
B) 18%
C) 20%
D) 25%
E) 30%
Correct Answer: D
Solution :
| Passengers of airline A who travelled to Chennai |
| First quarter \[=10000\] |
| Second quarter \[=\frac{15000\times 100}{120}=12500\] |
| Third quarter \[=\frac{15000\times 100}{120}=12500\] |
| \[\therefore \]Percentage increase \[=\frac{12500-10000}{10000}\times 100\] |
| \[=\frac{250000}{10000}=25\]% |


You need to login to perform this action.
You will be redirected in
3 sec

