| Directions: Study the following graph to answer the given questions. |
| Production of two companies A and B over the years (in lakh units) |
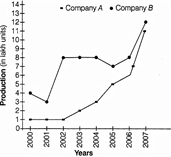 |
| Which of the following is the closest average production (in lakh units) of company A for the given years? |
A) 4.1
B) 3.5
C) 4.3
D) 3.75
E) 3.9
Correct Answer: E
Solution :
| Required average production of company A |
| \[=\frac{31}{8}\]lakh units \[=3.875\]lakh units \[\simeq 3.9\] lakh units |


You need to login to perform this action.
You will be redirected in
3 sec

