| Directions: Study the following graph to answer the given questions. |
| Production of two companies A and B over the years (in lakh units) |
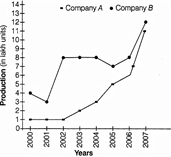 |
| For company B, what is the per cent decrease in production from 2000 to 2001? |
A) 75
B) 50
C) 25
D) 10
E) None of these
Correct Answer: C
Solution :
|
||||||
| \[=\,\frac{(4\,-\,3)}{4}\,\times \,100\]% =\[\frac{1}{4}\,\times \]100% = 25% |


You need to login to perform this action.
You will be redirected in
3 sec

