 |
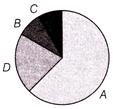
| I. Methane |
| II. \[CF{{C}_{5}}\] |
| III. \[C{{O}_{2}}\] |
| IV. \[{{N}_{2}}O\] |
A) A-IV, B-I, C-III, D-II
B) A-II, B-I, C-IV, D-III
C) A-III, B-II, C-IV, D-I
D) A-I, B-IV, C-III, D-II
Correct Answer: C
Solution :
Students learn this pie chart by heart as it is giver in NCERT.


You need to login to perform this action.
You will be redirected in
3 sec

