| Directions: Study the following graph carefully and answer the questions given below it. Target and actual production of cement (in 1000 gunny bags) of a factory for a period of six years |
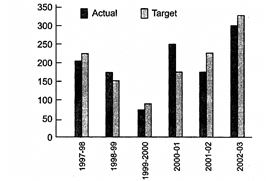 |
A) 2001-02
B) 2002-03
C) 1999-2000
D) 1997-98
Correct Answer: A
Solution :
\[\text{2001-02}=\frac{175}{250}\times 100=128.5%\] \[\text{2002-03}=\frac{325}{300}\times 100=108.33%\] \[\text{1999-2000}=\frac{95}{75}\times 100=126.6%\] \[\text{1997-98}=\frac{225}{200}\times 100=112.5%\]


You need to login to perform this action.
You will be redirected in
3 sec

