| Directions: Study the following graph carefully and answer the questions given below. |
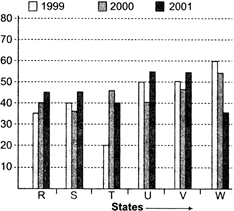
| Production of Rice in 6 states in 1999, 2000 and 2001 |
 |
A) 5.14
B) 6.14
C) 2.17
D) 4.17
Correct Answer: D
Solution :
| Total production in \[2000=40+35+45+45+40+50\]= 255 |
| \[\therefore \]Average production in \[2000=\frac{255}{6}\] |
| Total production in |
| \[2001=45+45+40+55+55+40\] |
| = 280 |
| \[\therefore \] Average production in \[2001=\frac{280}{6}\] |
| Average difference\[=\frac{280}{6}-\frac{255}{6}=\frac{25}{6}\] |
| = 4.17 (approx.) |


You need to login to perform this action.
You will be redirected in
3 sec

