| Directions: Study the following graph carefully and answer the questions given below. |
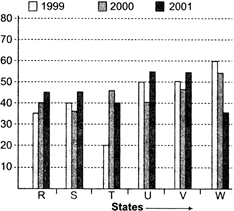
| Production of Rice in 6 states in 1999, 2000 and 2001 |
 |
A) R
B) S
C) T
D) U
Correct Answer: C
Solution :
Per cent increase/decrease \[=\frac{\text{Difference}\,\,\text{between}\,\,\text{final}\,\text{and}\,\,\text{initial}\,\,\text{values}}{\text{Initial}\,\,\text{value}}\] Per cent increase/decrease from 2000 to 2001 R = 12.5% S = 2857% T = 11.11% U = 2222% V = 37.5% W = 20%


You need to login to perform this action.
You will be redirected in
3 sec

