| Directions: Study the following graph carefully and answer the questions given below. |
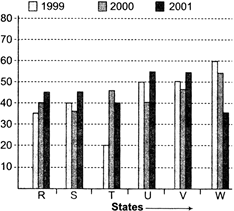
| Production of Rice in 6 states in 1999, 2000 and 2001 |
 |
A) 3 : 5
B) 2 : 3
C) 1 : 2
D) 2 : 5
Correct Answer: C
Solution :
Miniumum production in state T in 1999 = 30 lakh tonne Maximum production in state W in 1999 = 60 lakh tonne Required ratio \[=\frac{30}{60}=\frac{1}{2}=1:2\]


You need to login to perform this action.
You will be redirected in
3 sec

