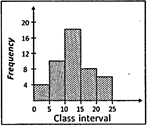
8th Class Mental Ability Data Handling Question Bank Statistics

  • question_answer
    There are several histograms as shown below, find which one of the following represents the histogram of the data given in the table below?
    Class Interval Frequency
    0 - 5 4
    5 - 10 10
    10 - 15 18
    15 - 20 8
    20 - 25 6

    A)           

    B)       

    C)                                    

    D) All of these

    E) None of these

    Correct Answer: A


You need to login to perform this action.
You will be redirected in 3 sec spinner