The following bar graph shows the production of food
grains in an Indian state during the five consecutive years:
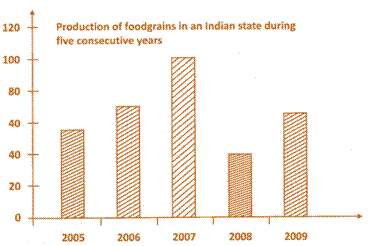 Read the bar
graph carefully and answer the following questions:
Read the bar
graph carefully and answer the following questions:
A) The given graph shows the annual production of food grains in an Indian state during the period from 2005 to 2006.
B) The given graph shows the annual production of food grains in an Indian state during the period from 2005 to 2007.
C) The given graph shows the annual production of food grains in an Indian state during the period from 2005 to 2008.
D) The given graph shows the annual production of food grains in an Indian state during the period from 2005 to 2009.
E) None of these
Correct Answer: D
Solution :


You need to login to perform this action.
You will be redirected in
3 sec

