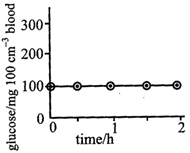
 Which one of the following graphs would apply to a diabetic man in similar circumstances?
A)
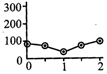
B)
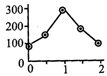
C)
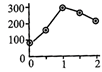
D)
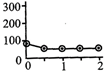
Correct Answer: C
Solution :
[c] In diabetics, the rise in blood glucose above the normal level of 80-90 mg/l00m fails to stimulate the production of insulin from the pancreatic P-cells of the Islets of Langerhans. As a result, the glucose is not removed from the blood to be stored in muscle cells as glycogen, resulting in a high blood glucose level for a long period of time.


You need to login to perform this action.
You will be redirected in
3 sec

