A) Melting point
B) Water gain
C) Heat loss
D) Boiling point
Correct Answer: D
Solution :
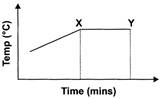
The given graph shows that the temperature of water is not increasing with time from period 'X' to 'Y', which shows that water has attained its boiling point \[({{100}^{o}}C)\]. On reaching boiling point, the temperature of water does not increase further and water converts into vapour,


You need to login to perform this action.
You will be redirected in
3 sec

