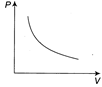
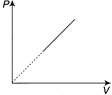
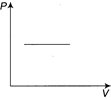
JEE Main & Advanced Physics Kinetic Theory of Gases Question Bank Mock Test - Kinetic Theory of Gases and Laws of Thermodynamics

  • question_answer
    The given curve represents the variation of temperature as a function of volume for one mole of an ideal gas. Which of the following curves best represents the variation of pressure as a function of volume?

    A)  

    B)  

    C)  

    D)  

    Correct Answer: A

    Solution :

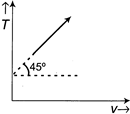
    [a] Here, \[T=V\tan 45{}^\circ +{{T}_{0}}\Rightarrow T=V+{{T}_{0}}\] And \[P=\frac{nRT}{V},\] \[\therefore \frac{PV}{R}=V+{{T}_{0}}\]                       (Since, n=1) \[(P-R)V=R{{T}_{0}}\] Therefore, graph will be rectangular hyperbola.


You need to login to perform this action.
You will be redirected in 3 sec spinner