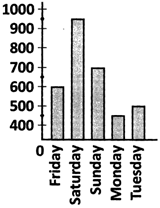
 Find out the difference between the total consumption for first 3 days and total consumption for the last 3 days.
A) 700 liters
B) 500 liters
C) 450 liters
D) 600 liters
Correct Answer: D
Solution :
Not Available


You need to login to perform this action.
You will be redirected in
3 sec

