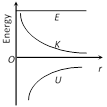
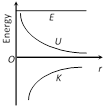
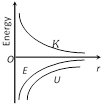
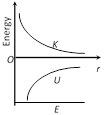
JEE Main & Advanced Physics Gravitation / गुरुत्वाकर्षण Question Bank Graphical Questions

  • question_answer
    The correct graph representing the variation of total energy \[({{E}_{t}})\] kinetic energy \[({{E}_{k}})\] and potential energy (U) of a satellite with its distance from the centre of earth is

    A)

    B)

    C)

    D)

    Correct Answer: C

    Solution :

        \[U=\frac{-GMm}{r},K=\frac{GMm}{2r}\] and \[E=\frac{-GMm}{2r}\] For a satellite U,K and E varies with r and also U and E remains negative whereas K remain always positive.


You need to login to perform this action.
You will be redirected in 3 sec spinner