JEE Main & Advanced Physics Fluid Mechanics, Surface Tension & Viscosity / द्रव यांत्रिकी, भूतल तनाव और चिपचिपापन Question Bank Graphical Questions

  • question_answer
    Which graph represents the variation of surface tension with temperature over small temperature ranges for water

    A)                          

    B)                           

    C)                       

    D)

    Correct Answer: B

    Solution :

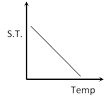
    \[{{T}_{c}}={{T}_{o}}(1-\alpha t)\] i.e. surface tension decreases with increase in temperature.


You need to login to perform this action.
You will be redirected in 3 sec spinner