A) A
B) B
C) C
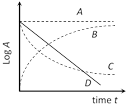
D) D
Correct Answer: D
Solution :
Activity \[A=\lambda \ {{N}_{0}}{{e}^{-\lambda t}}\] Þ\[{{\log }_{e}}A={{\log }_{e}}\lambda \,{{N}_{0}}+{{\log }_{e}}{{e}^{-\lambda t}}\] Þ \[{{\log }_{e}}A={{\log }_{e}}C-\lambda t\] (Take l N0 = C) Þ \[{{\log }_{e}}A=-\lambda t+{{\log }_{e}}C\] This is the equation of a straight line having negative slope (= ? l) and positive intercept on loge A axis.


You need to login to perform this action.
You will be redirected in
3 sec

